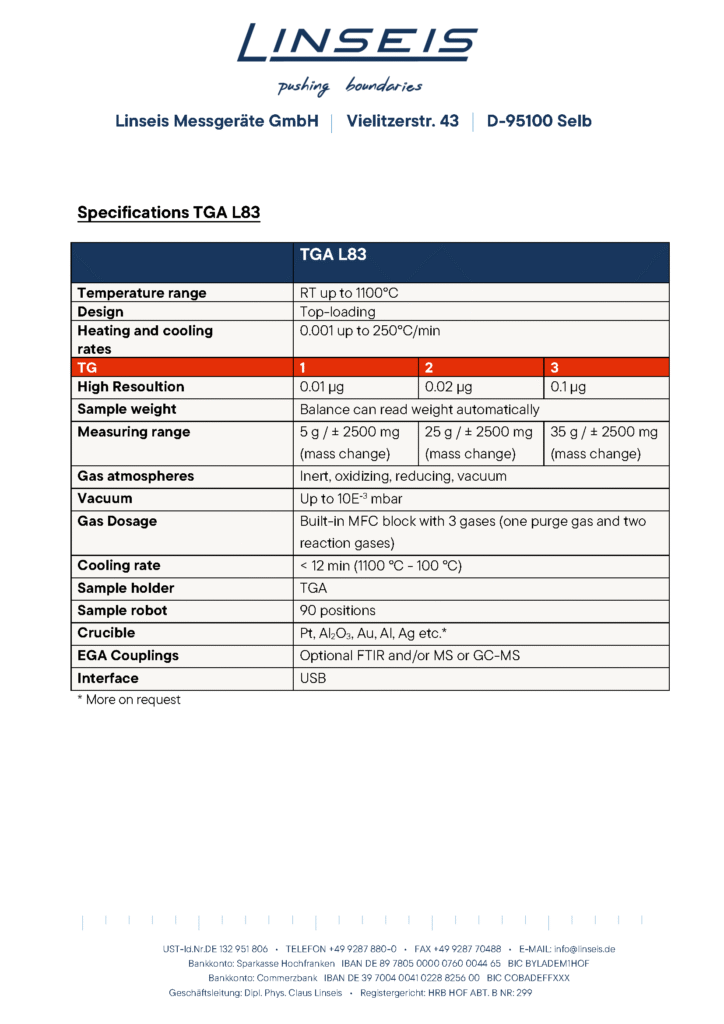


Measuring range: up to ± 2500 mg
Temperature range: RT up to 1100°C

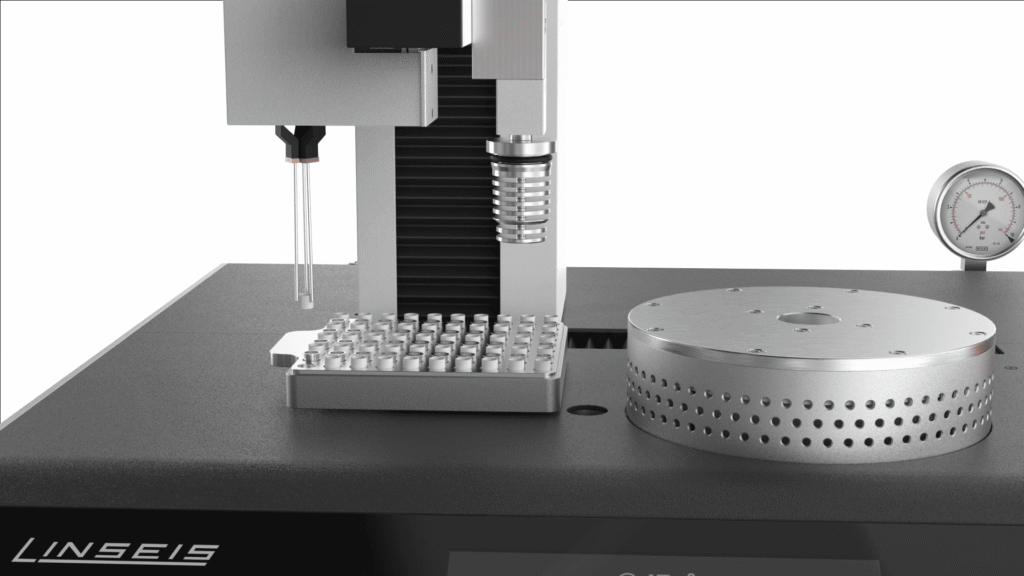
Up to 90 position auto-sampler

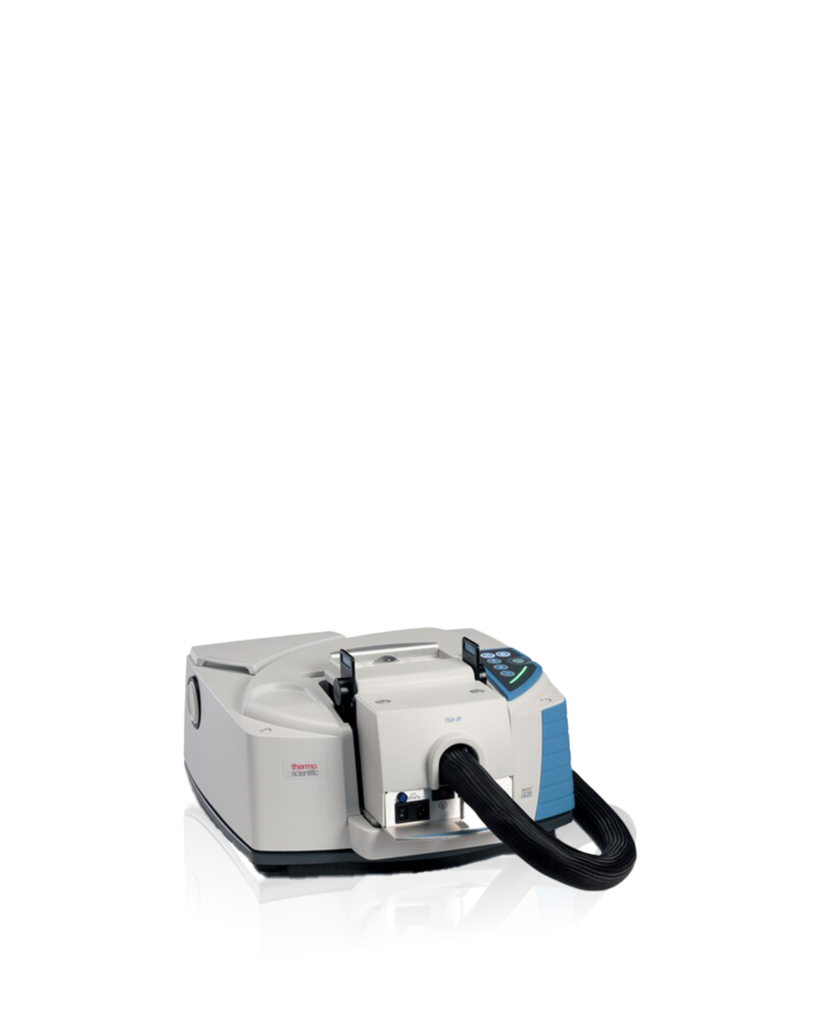
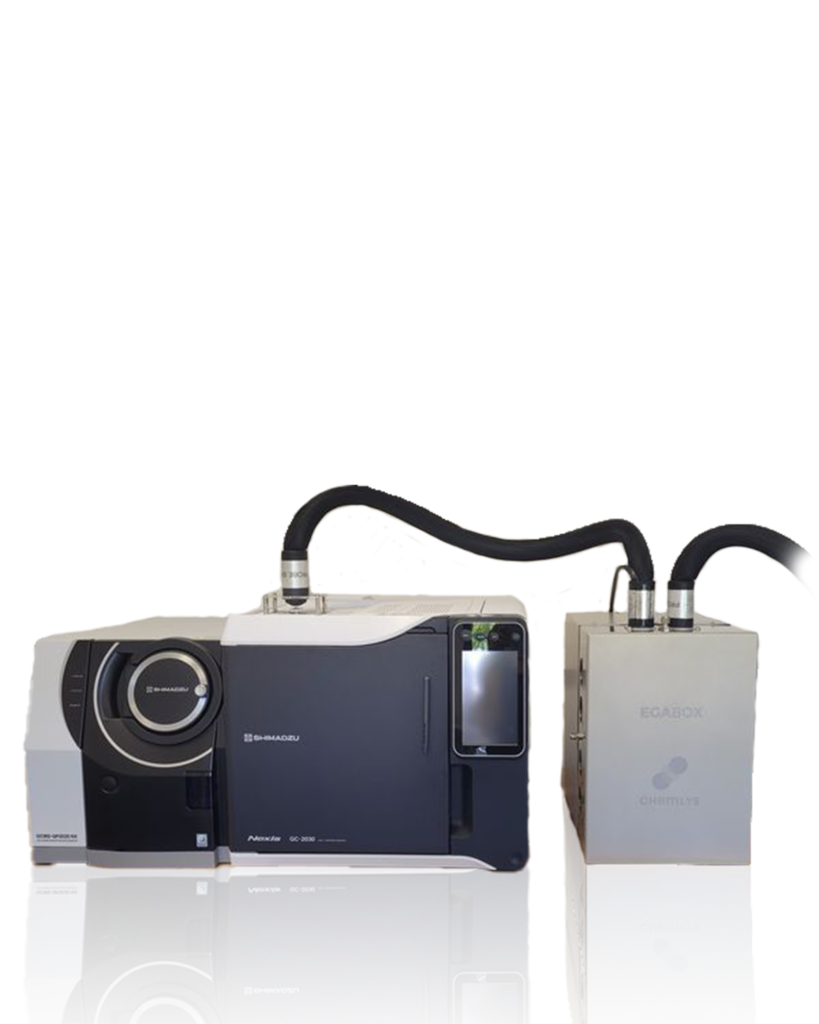
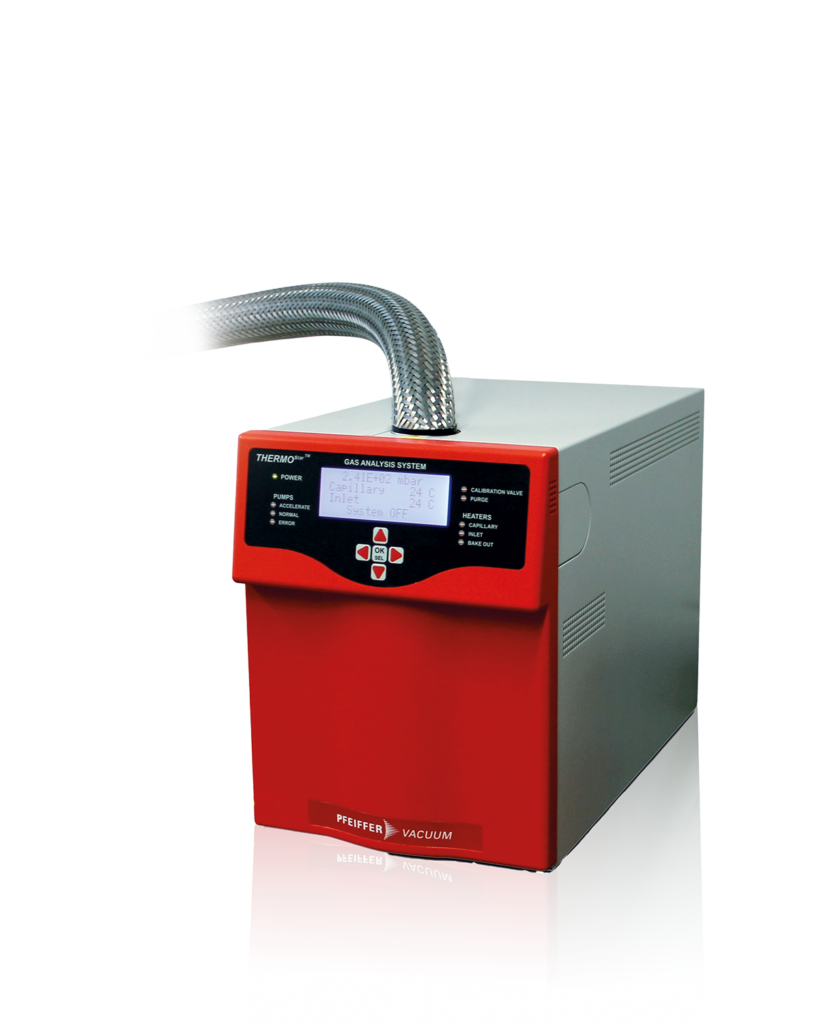
EGA - Evolved Gas Analysis
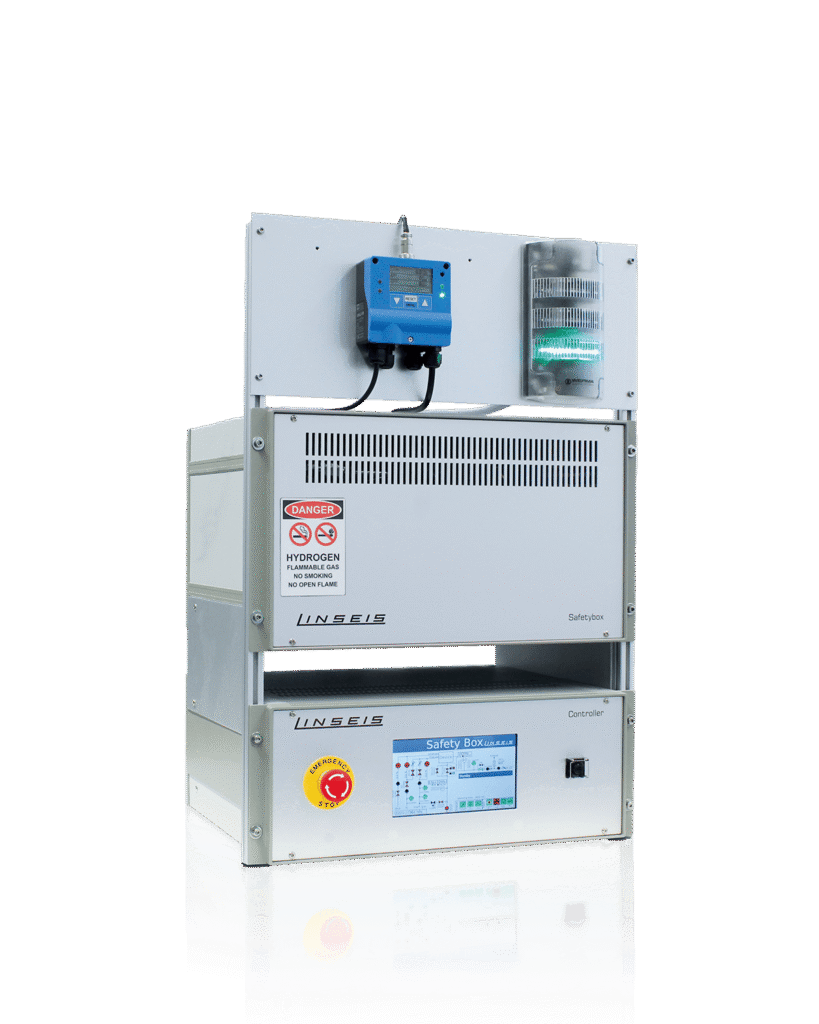
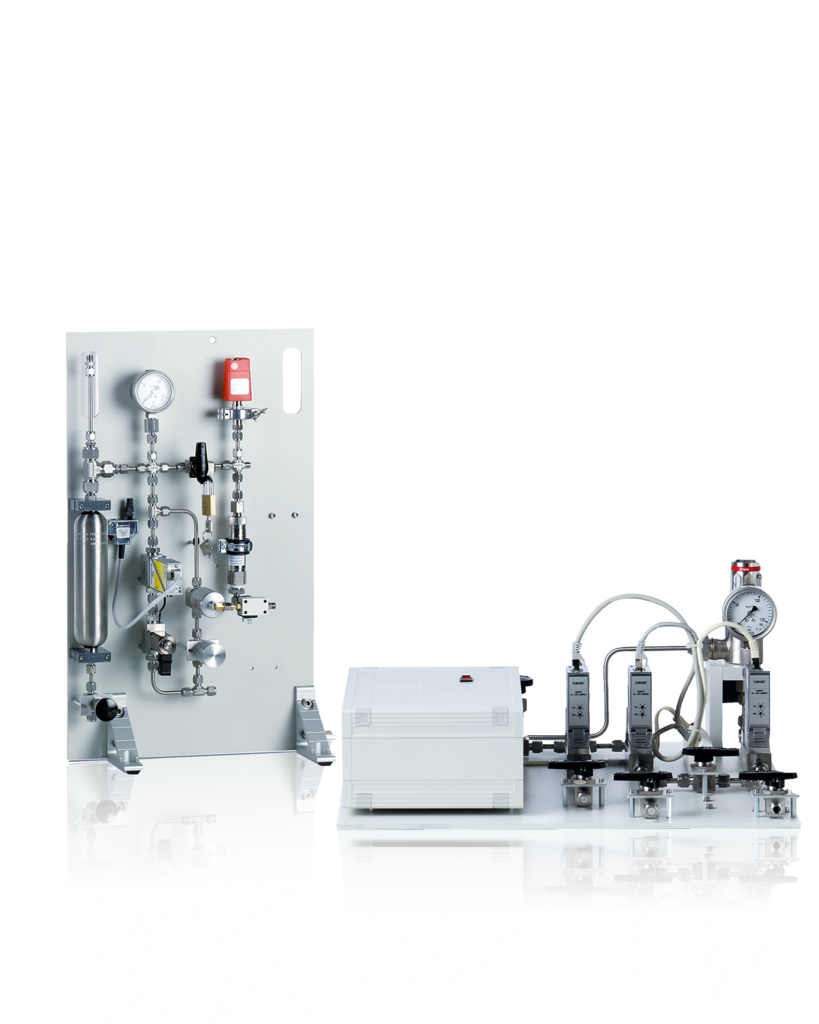
Gas Dosing & Gas Safety
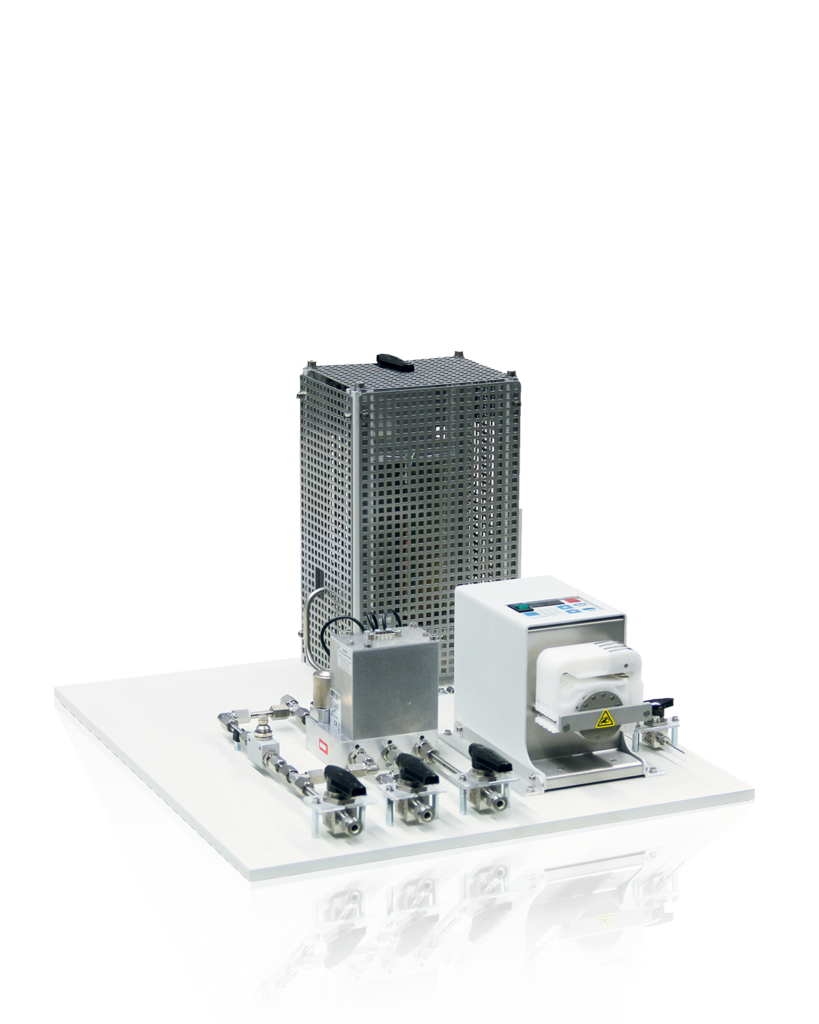
Water Vapor & Relative Humidity
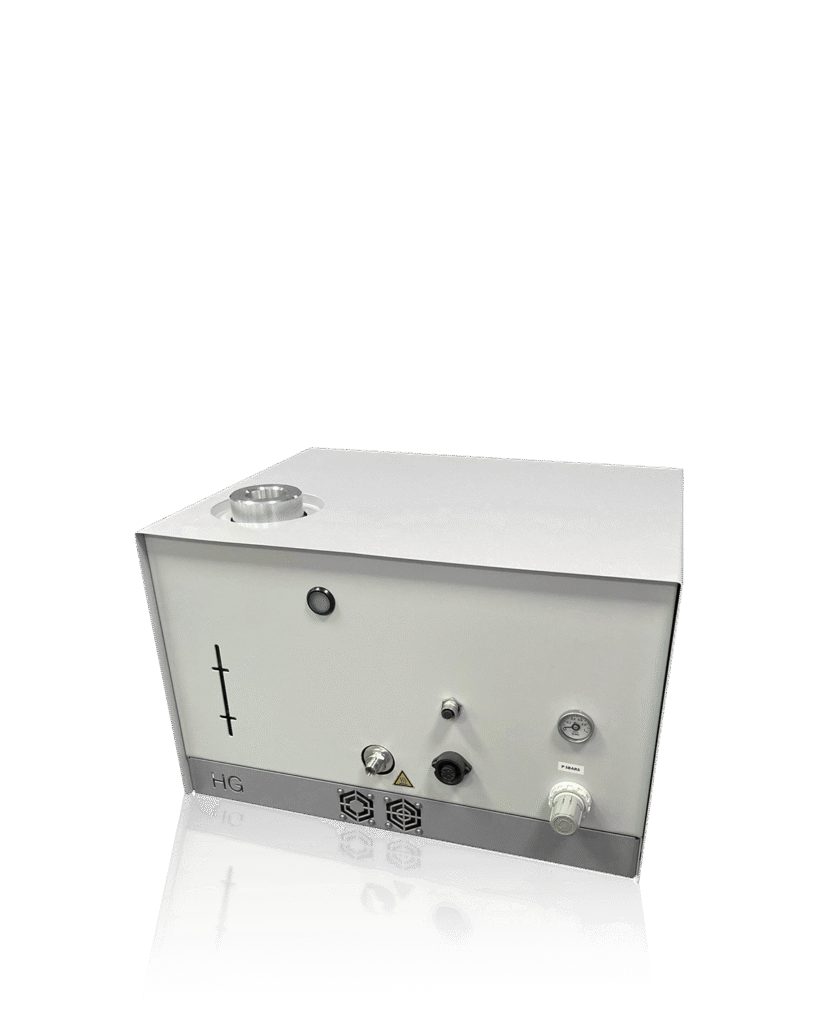
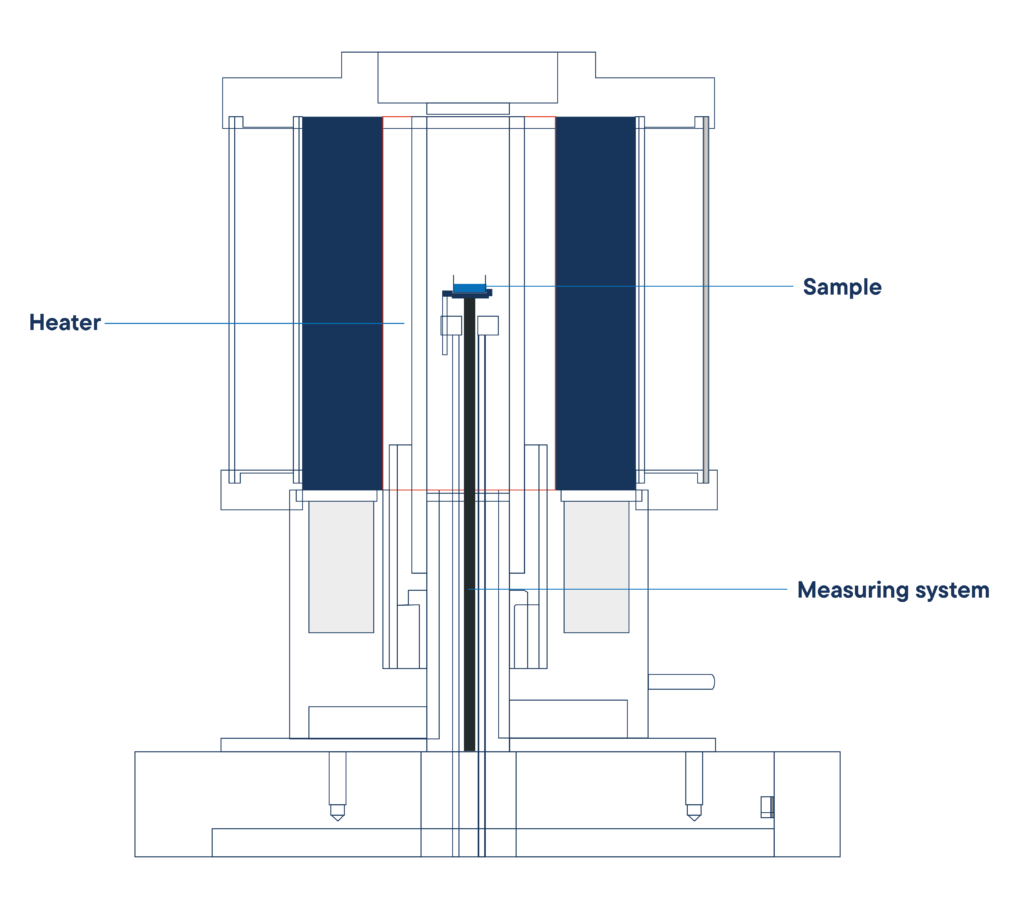
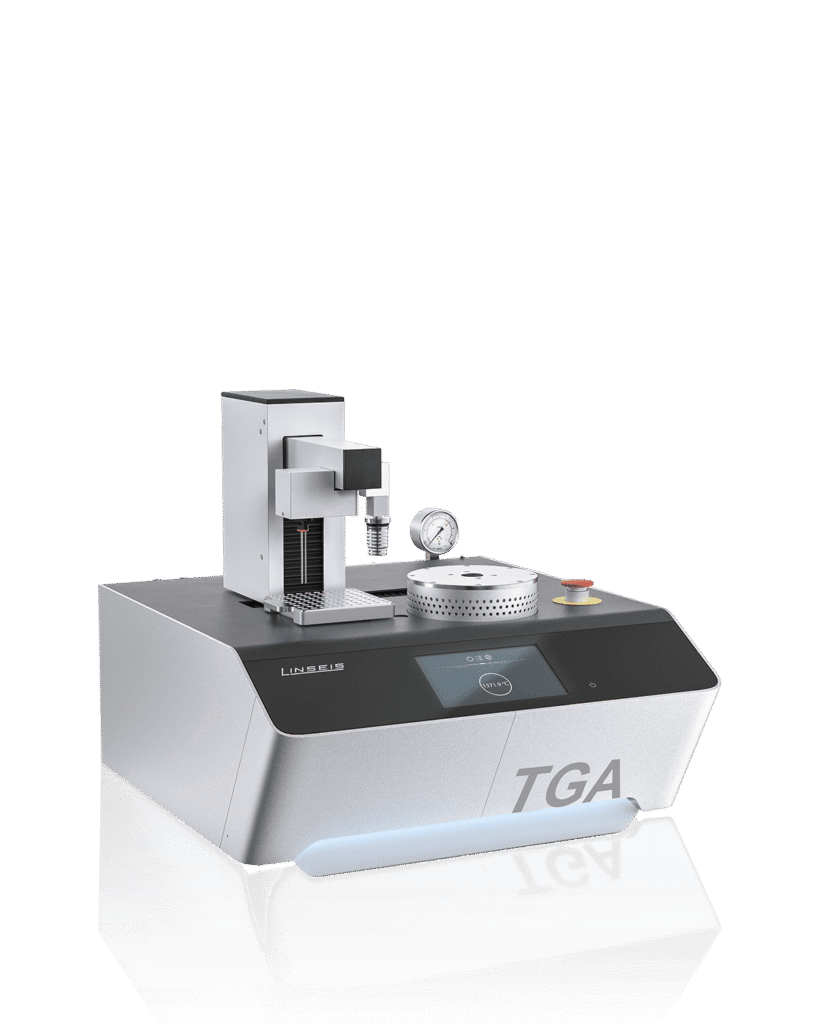
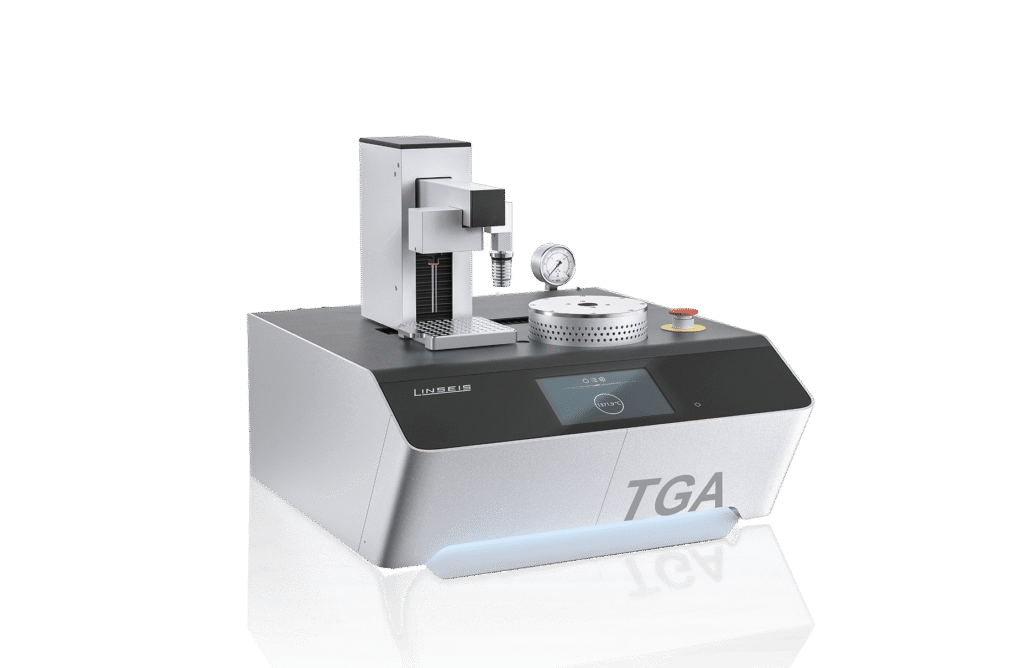
Functional Principle of the TGA L83
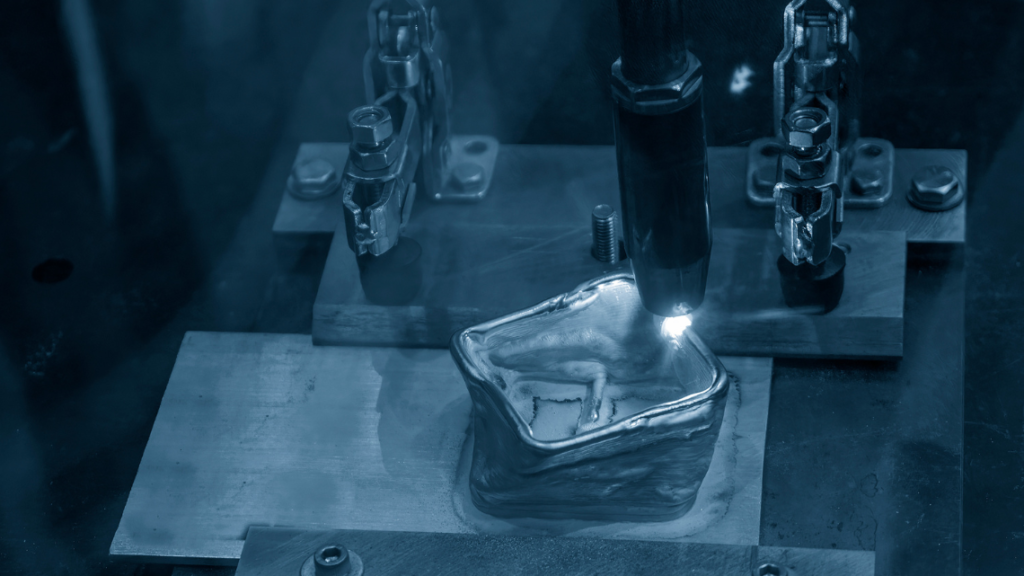
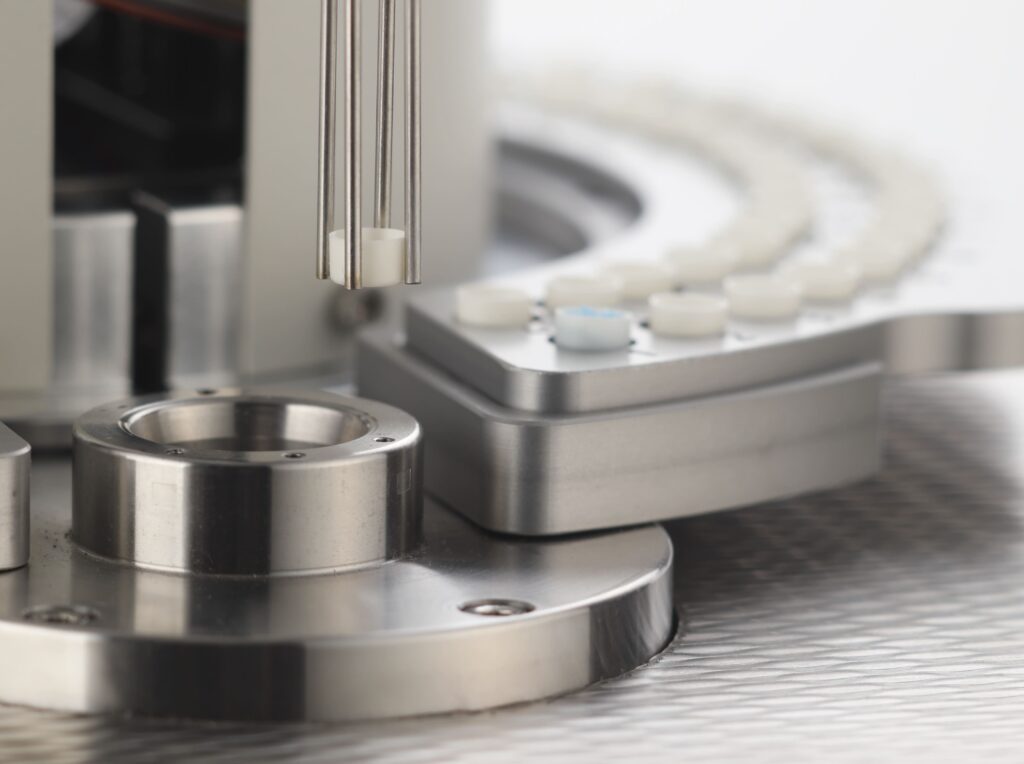
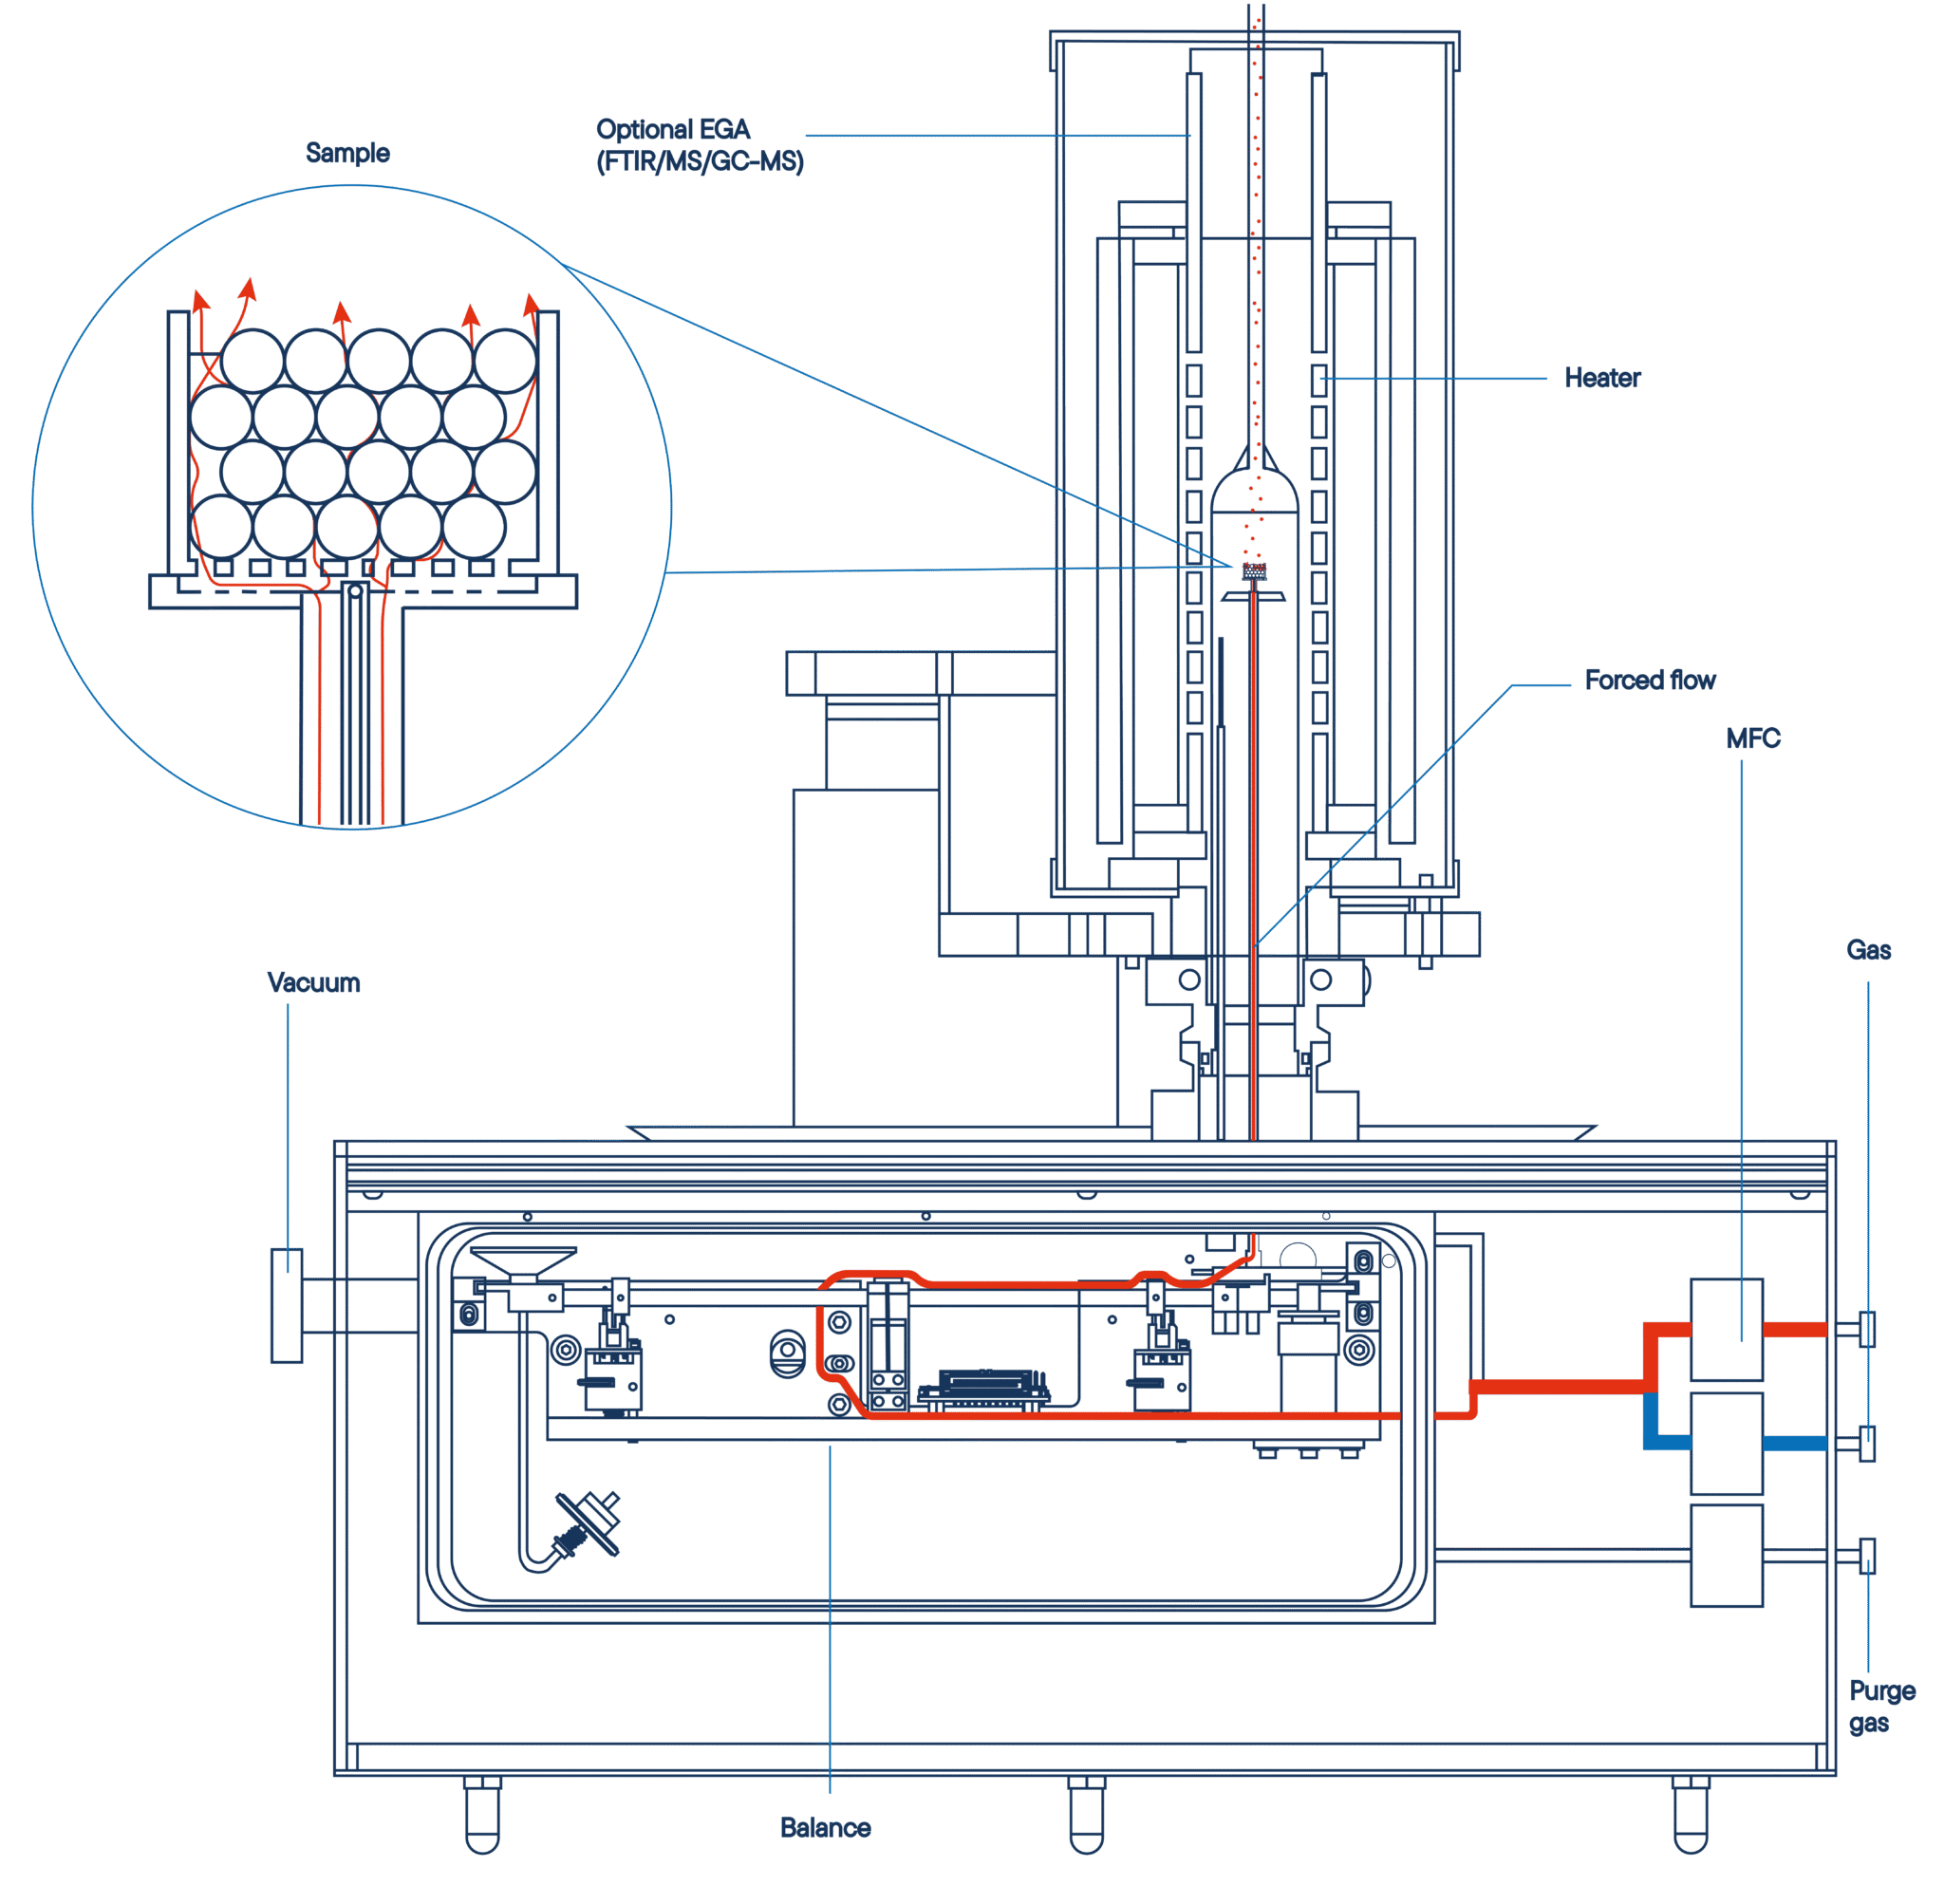
The TGA L83 determines changes in sample mass as a function of temperature or time under precisely controlled conditions.
During the measurement, the sample is placed in a crucible and subjected to a defined heating or cooling program in inert, oxidizing, reducing, or vacuum atmospheres.
Throughout the entire temperature cycle, the instrument continuously records the mass change of the sample with sub-microgram precision.
Weight losses or gains caused by decomposition, oxidation, reduction, or evaporation are detected with exceptional sensitivity and resolution.
This measurement principle allows a clear interpretation of thermal reactions and provides valuable information on material composition, stability, and decomposition mechanisms.
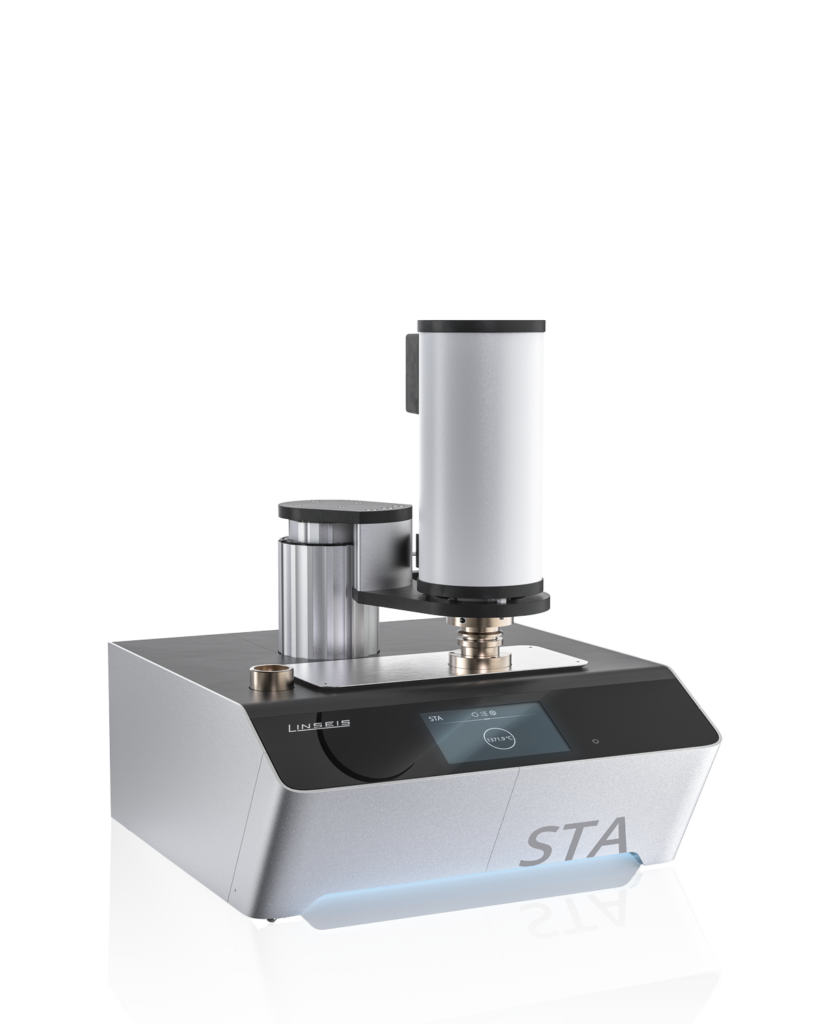
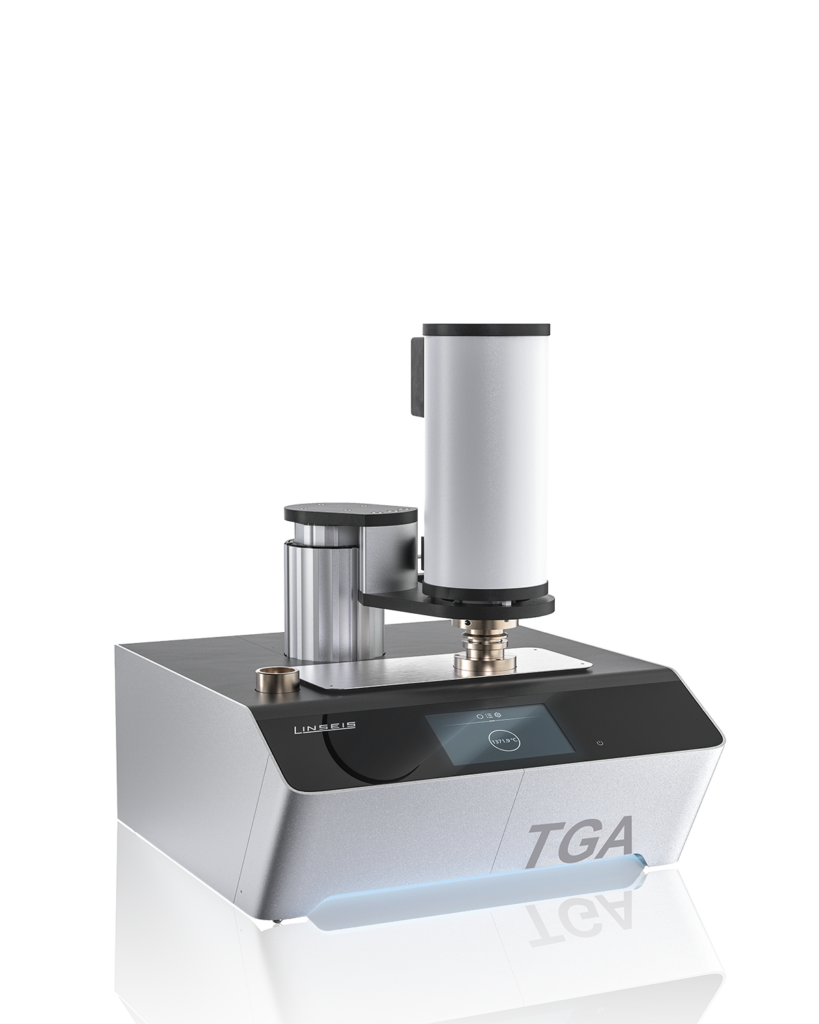
With its high-precision balance and advanced furnace control, the LINSEIS TGA L83 delivers reliable and reproducible data for both research and quality control applications.

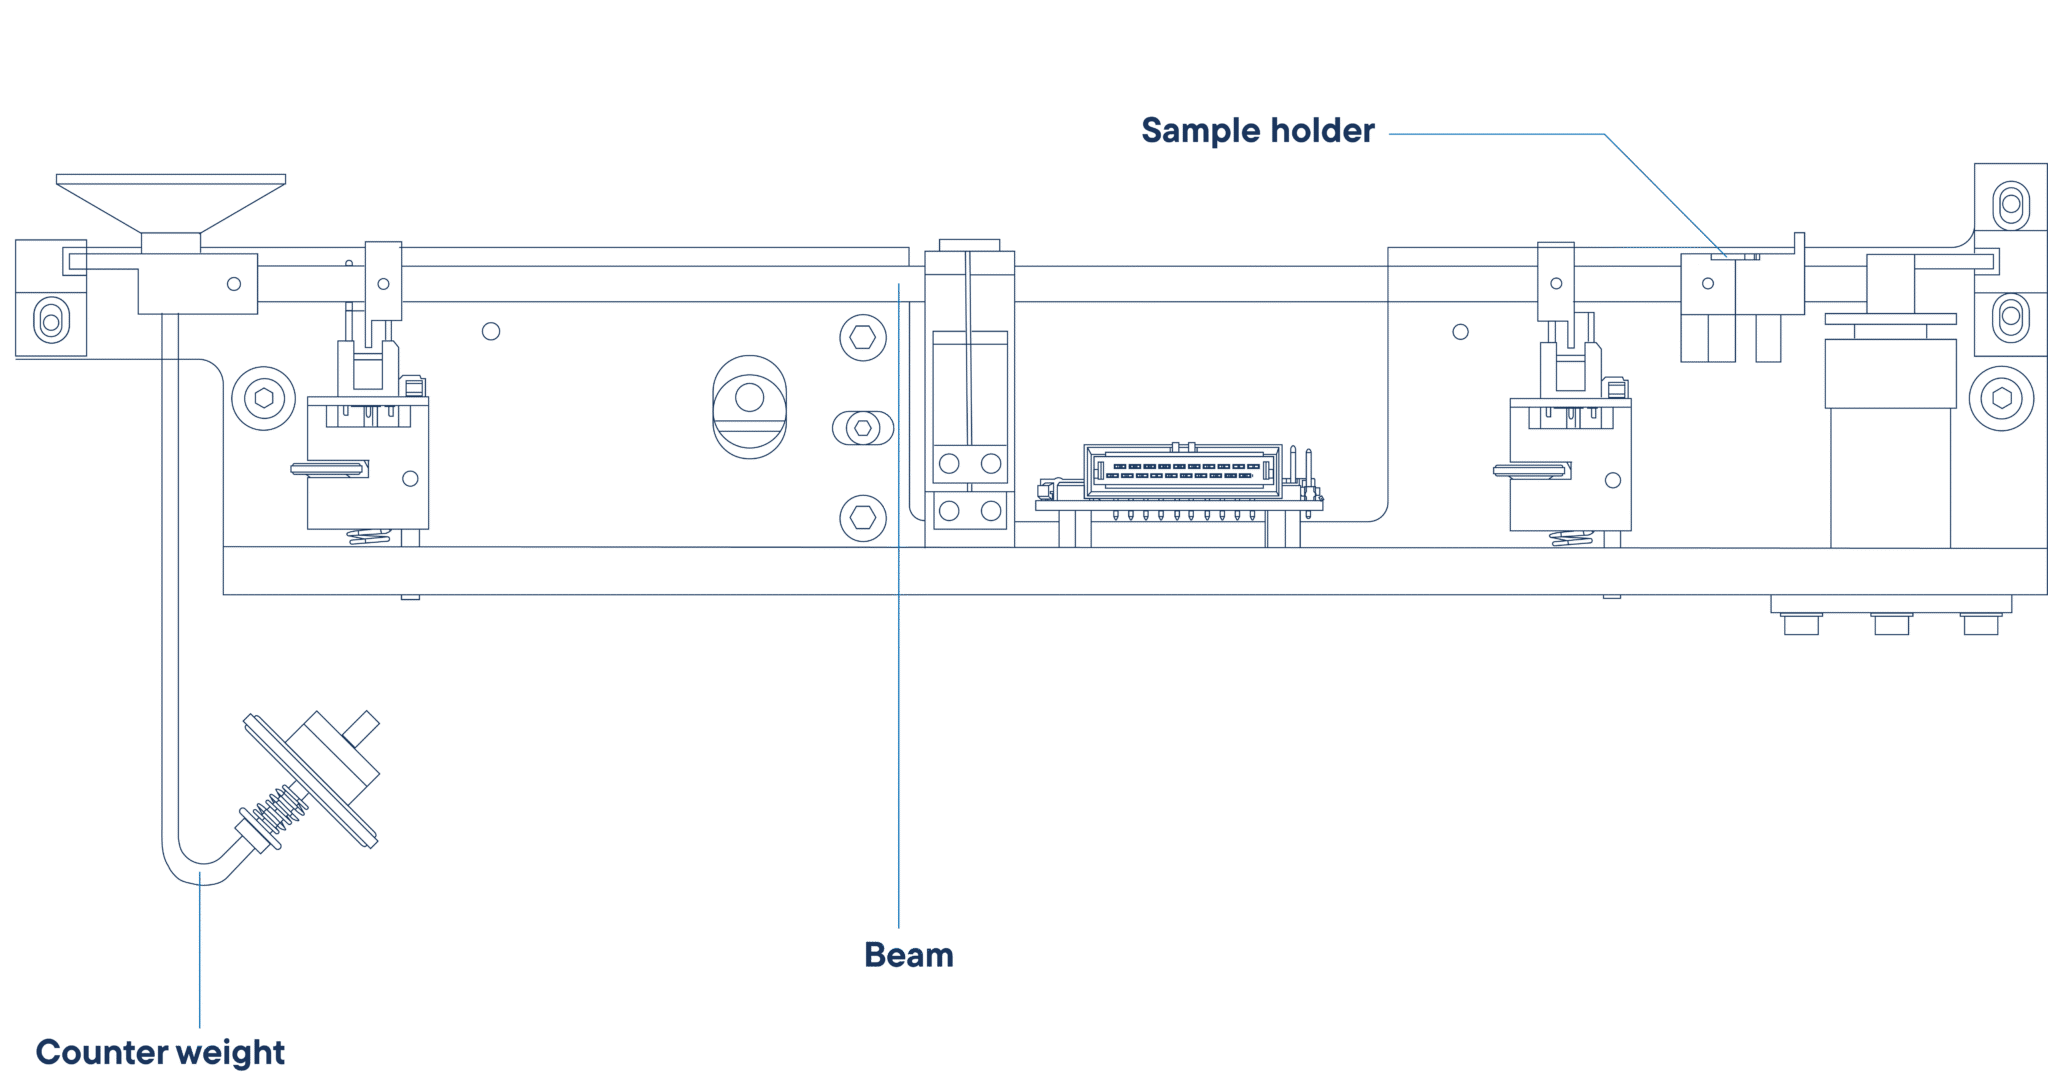
Beam Balance
Forced Flow


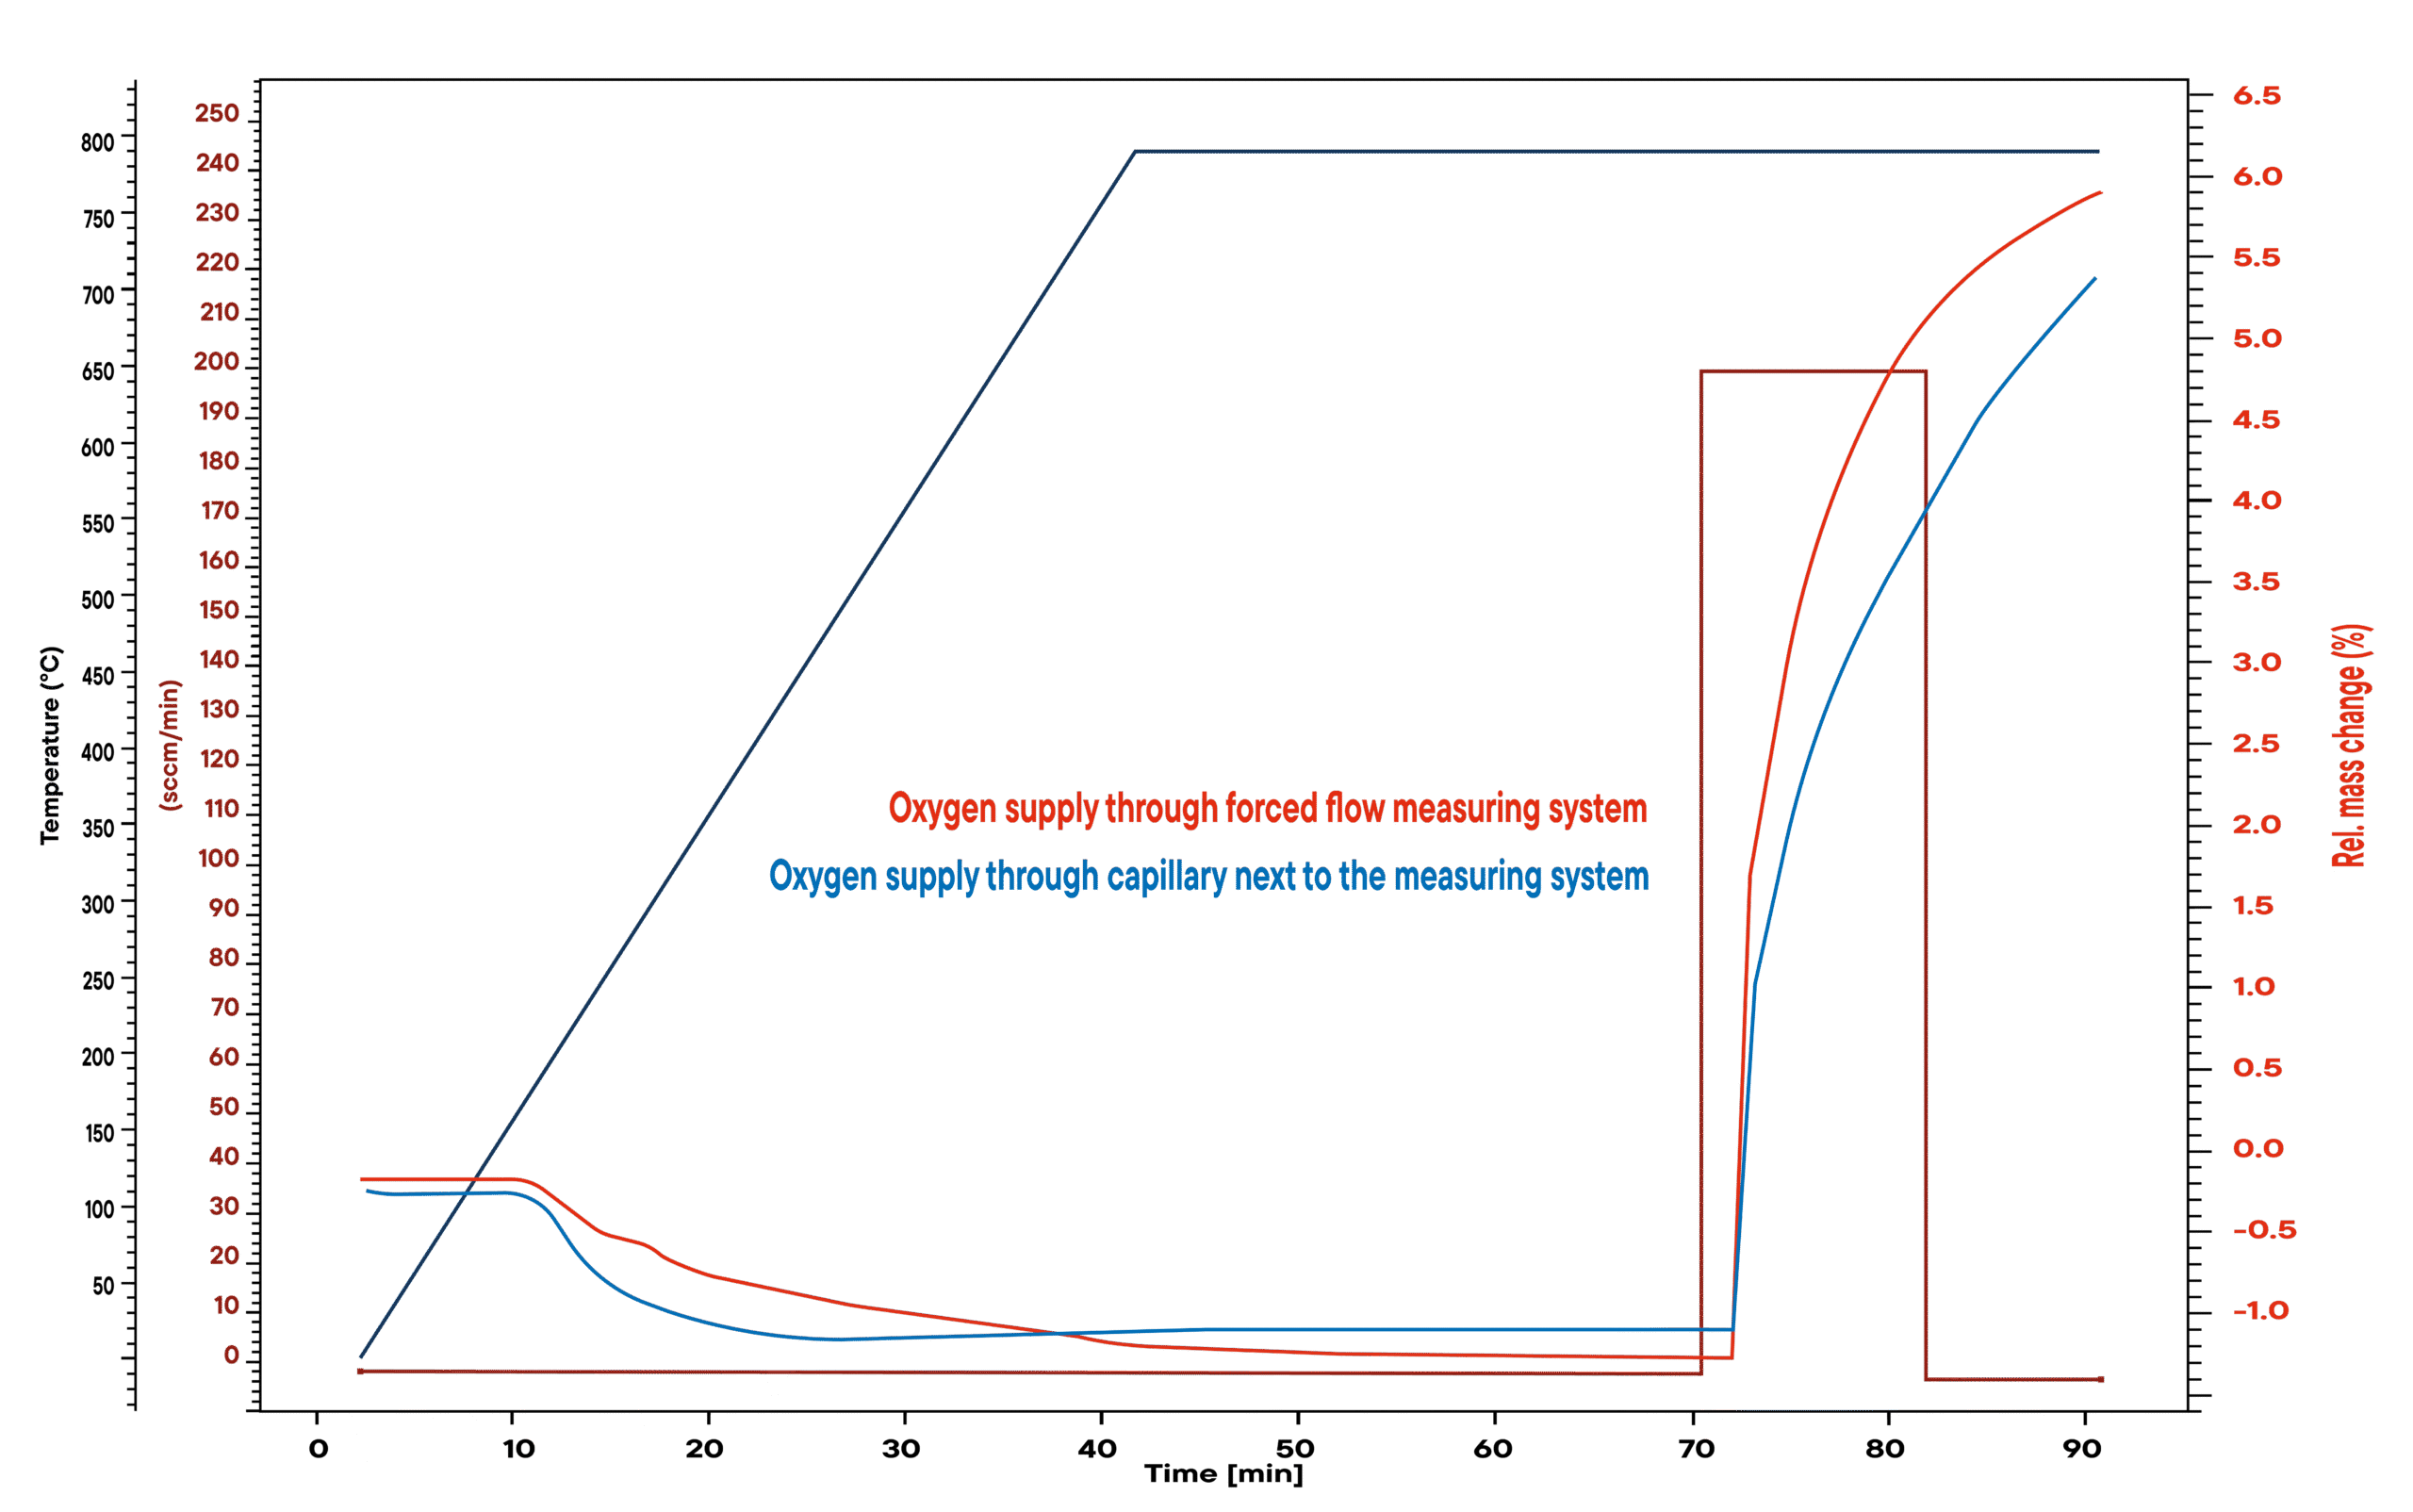
Oxidation rates of copper with different gas supplies
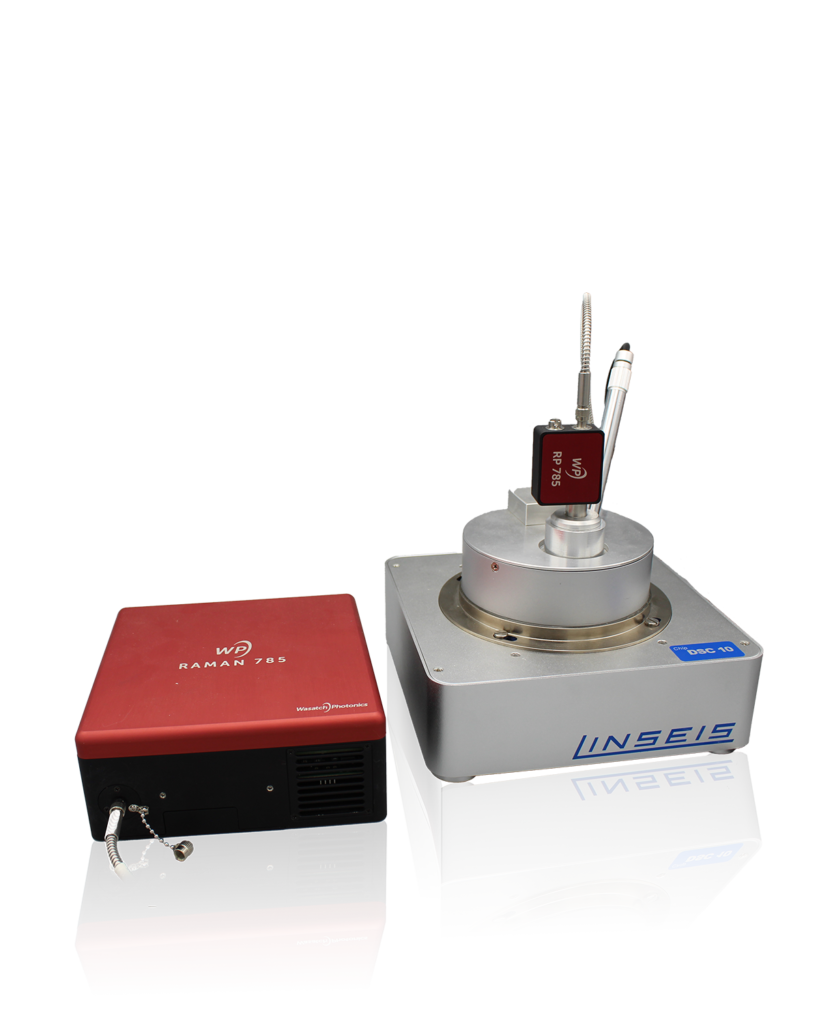
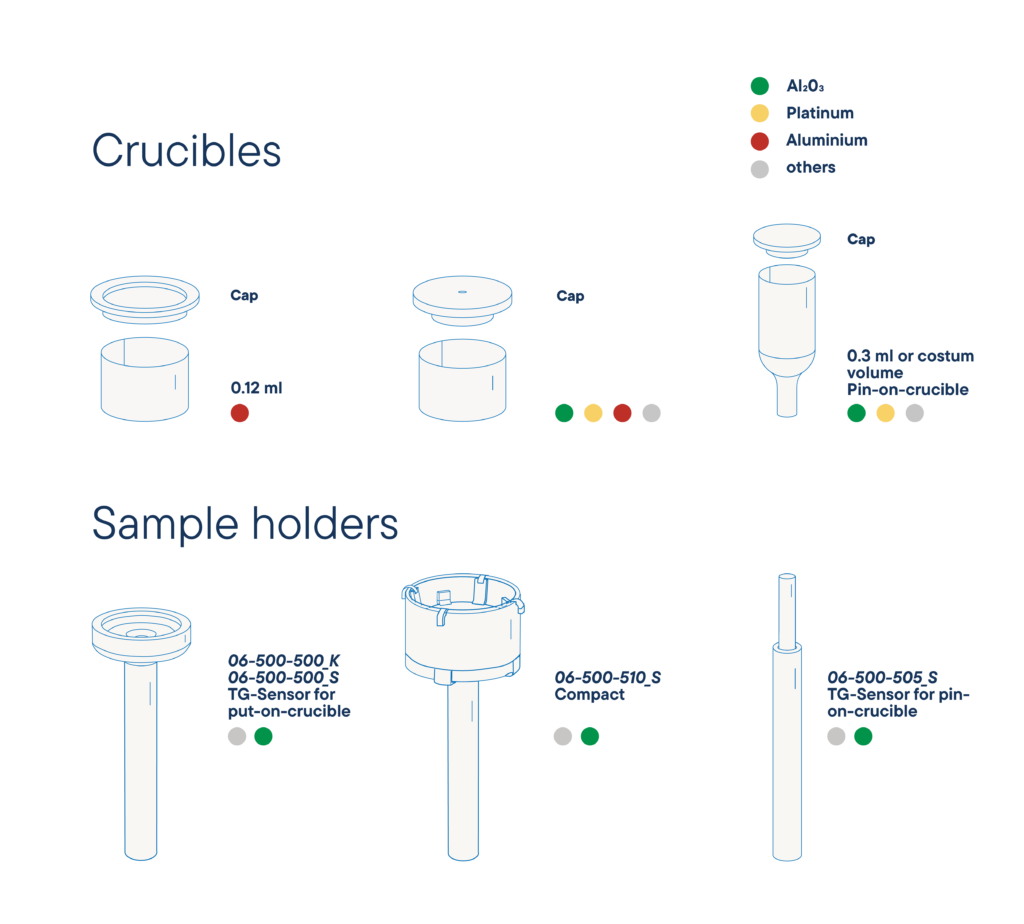
Which sensors and crucibles are available?
How much does an TGA L83 cost?
What is the delivery time for an TGA L83?
Can TGA systems perform pressure-dependent measurements?
Are measurements under hydrogen and water vapor atmospheres possible with TGA systems?
Can TGA systems be coupled with gas analyzers, and is in-situ gas analysis possible?

Automotive and aerospace industry

Building materials

Cosmetics, Pharmaceuticals and Food