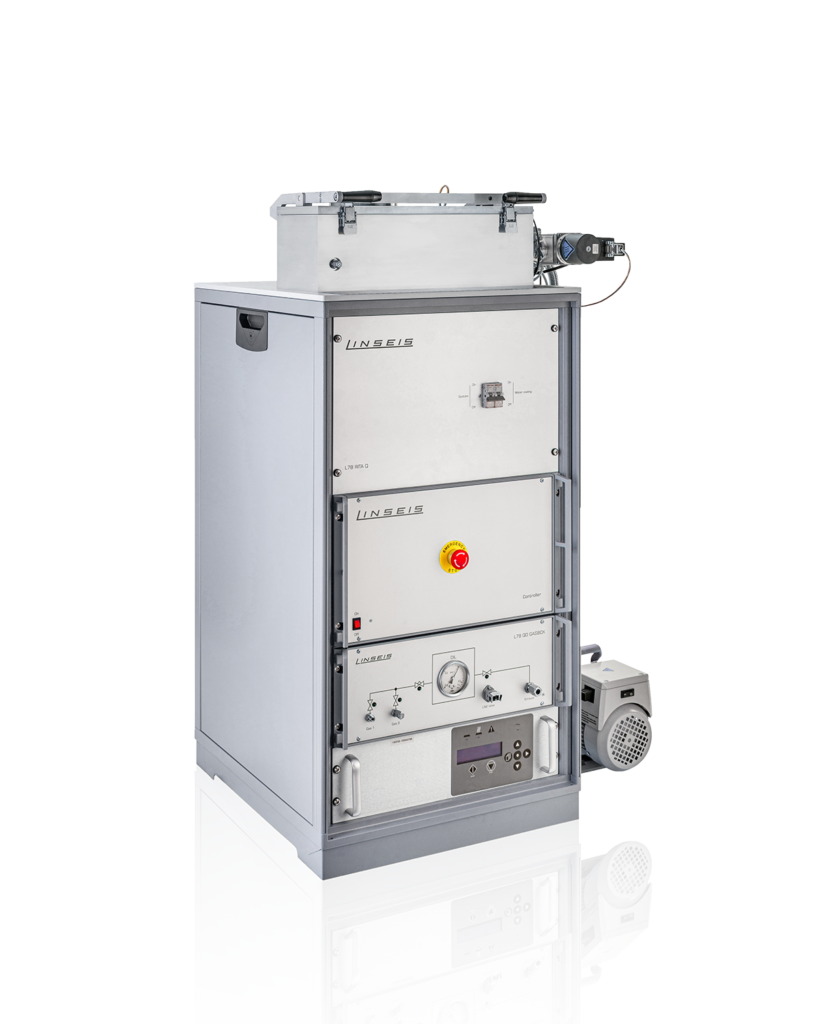
DIL L78 / RITA

Quenching and forming dilatometer / TTT- CCT- CHT diagrams

Description

To the point

Quenching is the rapid cooling of a heated materital in a quenching
medium (in our chase gas) to achieve. In metallurgy, quenching
is one of the critical steps in the heat treatment of a metal
and is typically used to harden the final product, e.g. steel.

Our quenching dilatometers allow us to simulate production processes with complex temperature
profiles for optimizing steels, alloys, and other metals. Especially for steels, many phase transitions
come along with a change in density or at least a change in the expansion coefficient of the material.
The simultaneous dilatation measurement of the L78 makes it therefore possible to detect phase transitions
of the micro sturcture of the sample during the heat treatment cycle. This is of great importance
for the optimization of your production processes.

TTT – CCT – CHT – Diagram

There are three main types of transformation diagram that are useful in selecting the optimum steel and processing route to achieve a given set of properties. These are Time Temperature Transformation (TTT), Continuous Cooling Transformation (CCT) and Continuous Heating Transformation (CHT) diagrams.

Metal Deformation

When a sufficient load is applied to a metal or other structural material, it causes the material to change shape. This change in shape is known as deformation. It is caused either by the mechanical action of external forces or by various physical and physiochemical processes. The deformed or mechanically worked metals are far superior to cast metals.

Tensile (load) tests and stress-strain curves

Stress-strain curves are an extremely important graphical measure of the mechanical properties of a material. The graph gives us many mechanical properties such as e-moduls, tensie strength and yiel strength. The stress-strain diagram expresses a relationship between a load applied to a material and the deformation of the material caused by the load. The stress-strain diagram is determined by tensile testing. Tensile tests are performed in tensile testing machines (DIL L78 Q/D/T), which provide a controlled, uniformly increasing tensile force applied
to the specimen.

Quenching dilatometer / Forming dilatometer DIL L78 QDT

Quenching mode:

  • Very low force
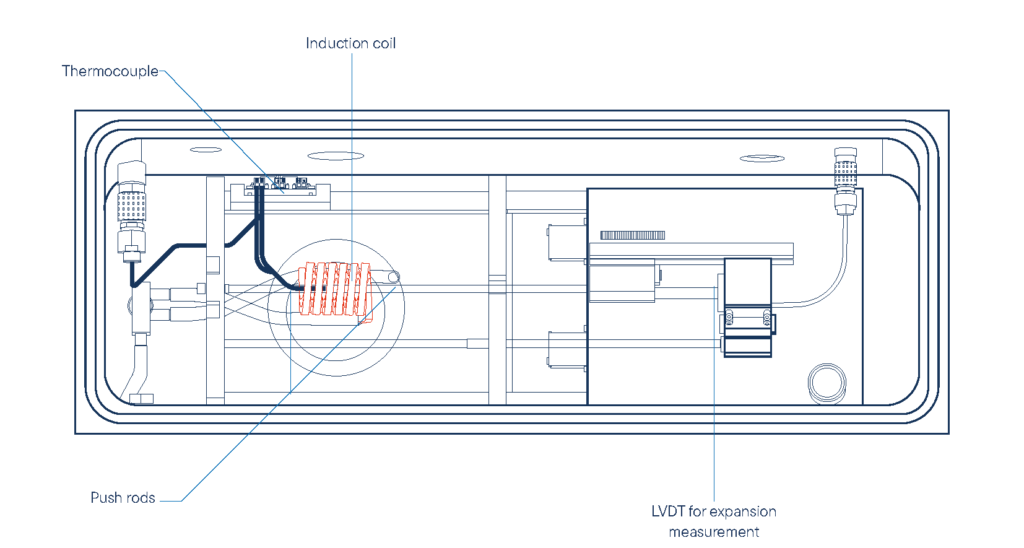
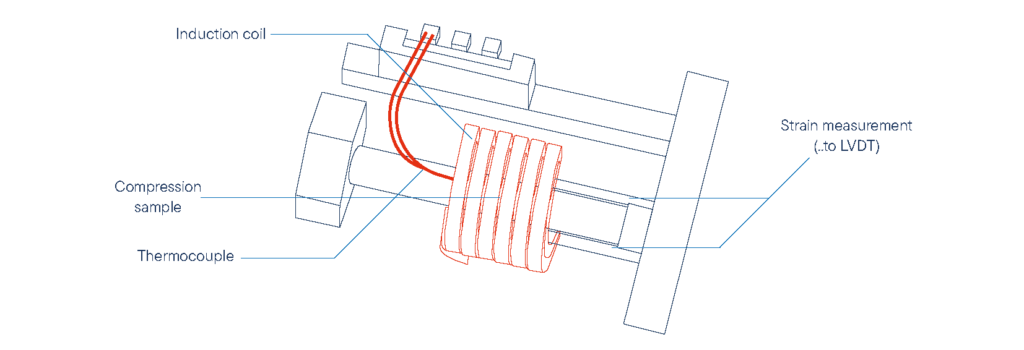
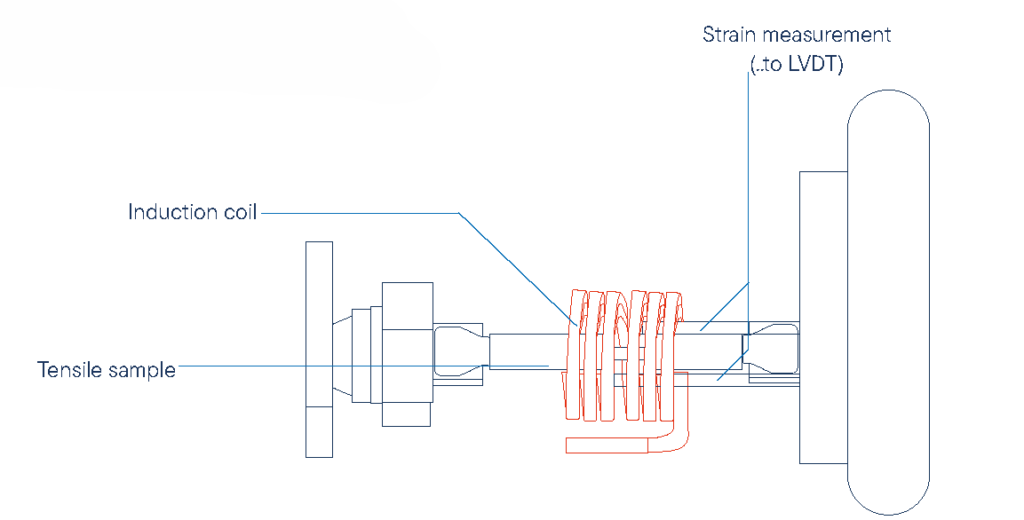
  • CTE – Coefficient of Thermal Expansion
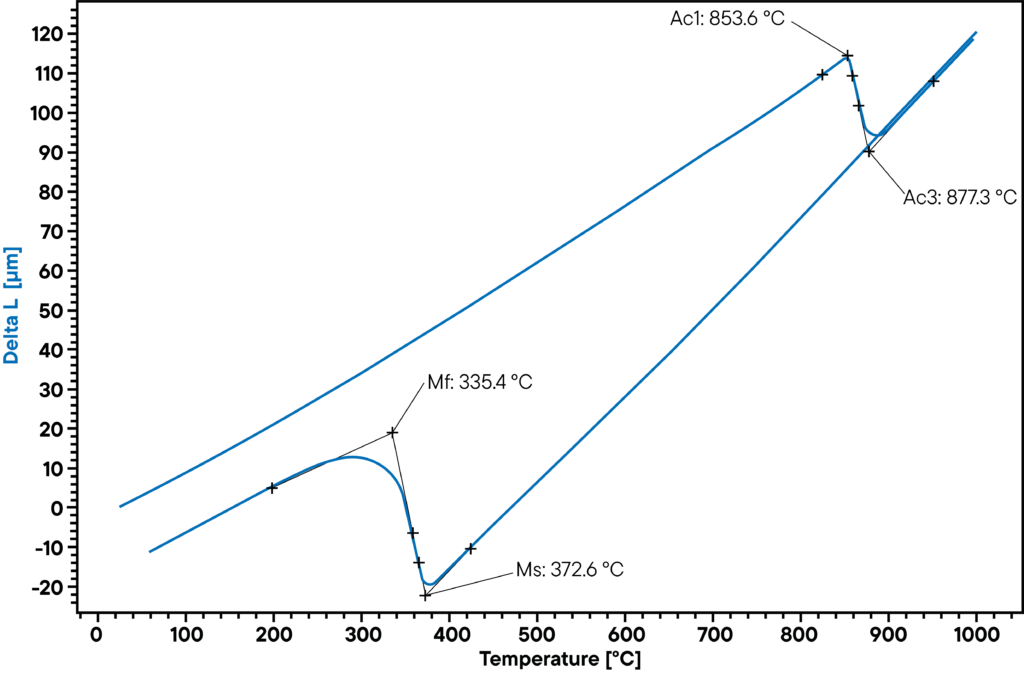
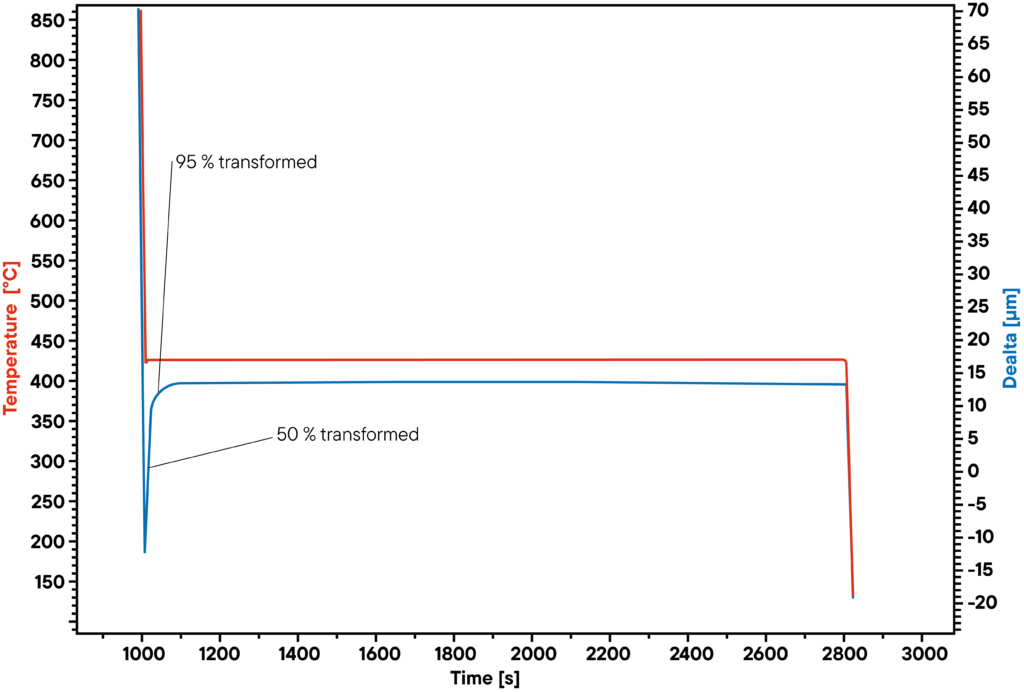
  • Creation of TTT diagrams
  • Determine phase changes at different cooling rates
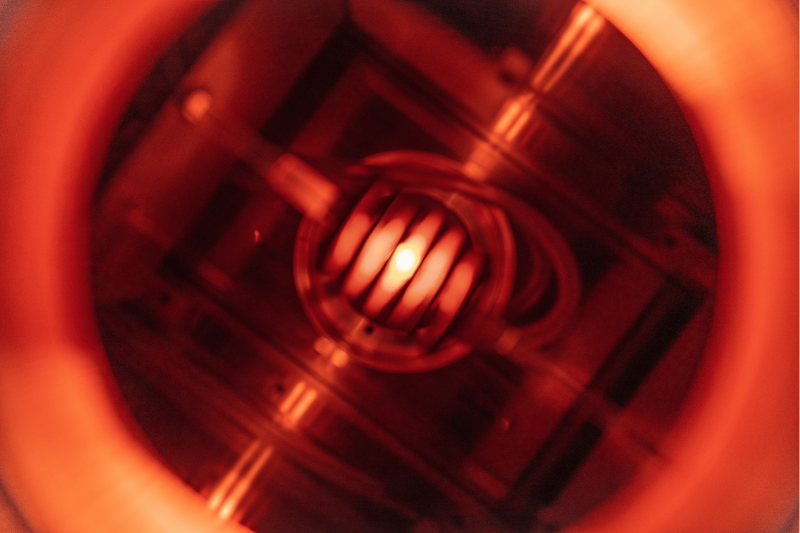
  • Maximum cooling: 4000 °C/s (hollow sample and maximum achievable cooling rate
  • Low temperature option (Tmin= -150 °C)
  • Optional Laser speckle measurement of expansion (patent no. DE 10 2017 216 714.9)

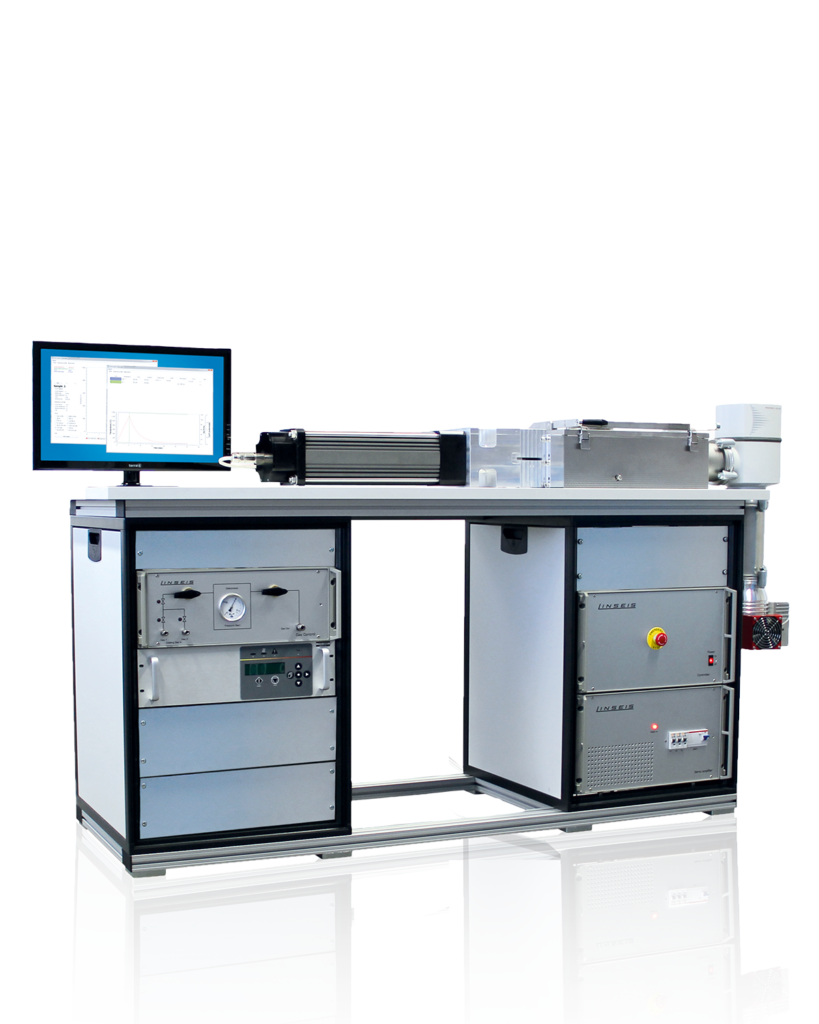
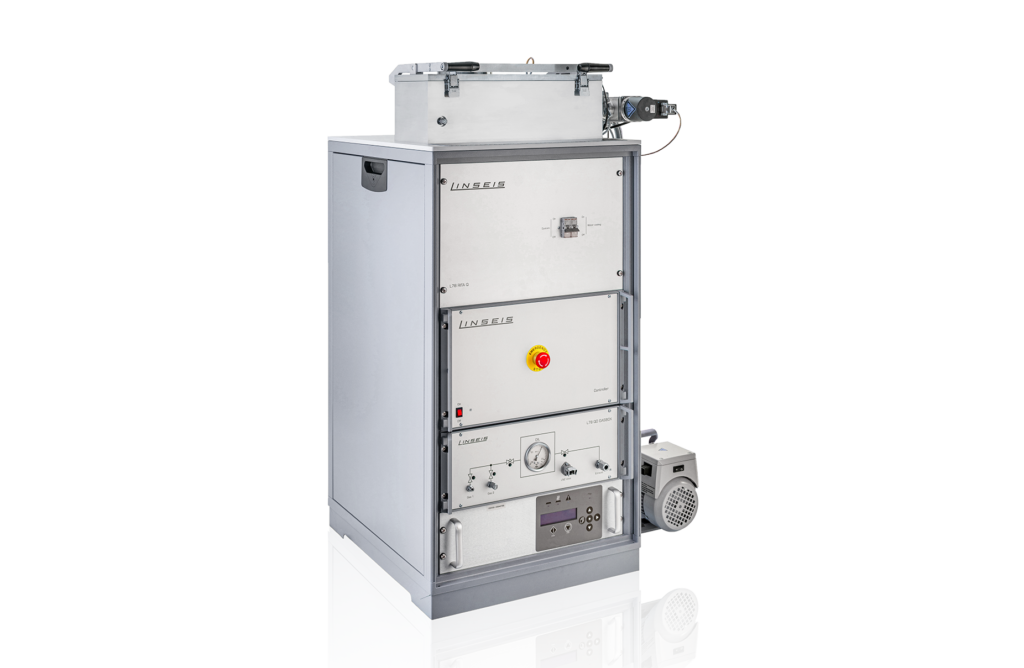
Accessories for quenching mode:

  • Various turbomolecular pumps (standard
    and high flow)
  • Thermocouple welder (optional inert gas
    mode)
  • Cryogenic add-on (-150 °C in quench
    mode)
  • Laser speckle option for 2-dimensional
    strain measurement
  • -150°C in quenching mode, -50°C in
    tension und deformation mode

Deformation mode

Deformation mode
  • Simulation of manufacturing processes with mechanical stress such as hot rolling or forging
  • Maximum cooling rate: 125 °C/s
    • Maximum force: 22 kN (compression)
    • Compression rate: 0.005 – 100 mm/s (more on request)

Tensile mode

  • E-modulus determination
  • Fracture Tests
  • Maximum cooling rate: 125 °C/s
  • Maximum force: 22 kN (tension)
  • Tensile speed: 0.005 – 100 mm/s
  • Various specimen shapes (flat, round)
  • Optional: Optical strain measurement

Unique features

Quick quenching with water, oil or air to improve hardness

Determination of TTT, CHT and CCT diagrams
in the temperature range from -150°C to 1600°C

Heating and cooling rates
to 2500°C/s

Use of induction furnaces and
high-speed dilatometers
for precise measurements

Questions? We're just a call away!

+01 (609) 223 2070


+49 (0) 9287/880 0

Our service is available Monday to
Thursday from 8 am to 4 pm
and Friday from 8 am to 12 pm.

We are here for you!

Specifications

MODEL

DIL L78/RITA Q *

Furnace:Induction furnace
Temperature range:-150 °C up to 1600 °C
(more on request)
Temperature measurement:up to 3 thermocouples welded to sample
Sample geometry:Ø 3 mm hollow: 3.5 mm OD /
3 mm ID 10 mm long
Sample geometry
(optional for heat treatment):
10x10x60 mm
(others on request)
Heating rates:≤ 4000 K / s**
Cooling rates:≤ 4000 K / s**
Measurement of length changes:+/- 1.2mm
Data sampling
(for temperature, length, force):
up to 1 kHz
Length change resolution:5 nm
Data resolution:24-bit
Instrument dimension:60x60x110 cm
(without accessories)
Power supply:16 A, 208-230 V
*Specifications depend on the configurations
**maximum heating/cooling rate, hollow sample

MODEL

DIL L78/RITA Q/D *

Furnace:Induction furnace
Temperature range:-150 °C up to 1600 °C (quenching
mode)
Sample dependent 1750 °C
Sample geometry quenching:Ø 3 mm rec.
hollow: 3.5 mm OD / 3 mm ID
10 mm long
Sample geometry compression:solid samples, diameter 5
mm, 10 mm long
Heating rates:≤ 125 K / s
Cooling rates:≤ 125 K / s
Lenght change measurement
Compression mode:
+/- 5 mm
Length change measurement
Quenching mode:
+/- 1.2 mm
Length measurement
resolution:
5 nm (optional 1nm)
Compression force:22 kN (max)
Stroke rate:0.005 - 100 mm/s (more on
request)
True strain
(compression mode):
-0.02 to -1.2
Data sampling
(for temperature, length,
force):
up to 1 kHz
Mechanical control modes:stroke, force, true strain rate
*Specifications depend on the configurations

MODEL

DIL L78/RITA Q/D/T*

Furnace:Induction furnace
Sample geometry quenching:Ø 3 mm rec.
hollow: 3.5 mm OD / 3 mm ID 10 mm long
Sample geometry compression:solid samples, diameter 5 mm, 10 mm long
Sample geometry tensile:round, flat sheet
Heating rates:≤ 125 K / s
Cooling rates:≤ 125 K / s
Length change measurement
compression mode:
+/- 5 mm
Length change measruement
quenching mode:
+/- 1.2 mm
Length measurement resolution:5 nm (optional 1 nm)
Compression/tensile force:22 kN (max)
Stroke rate
(compression and tensile):
0.005 - 100 mm/s
(more on request)
True strain
(compression mode):
-0.02 to -1.2
Data sampling
(for temperature, length, force)
up to 1 kHz
Mechanical control modes:Stroke, force, true strain rate
*Specifications depend on the configurations

Accessories

Laser speckle measurement of dilatation

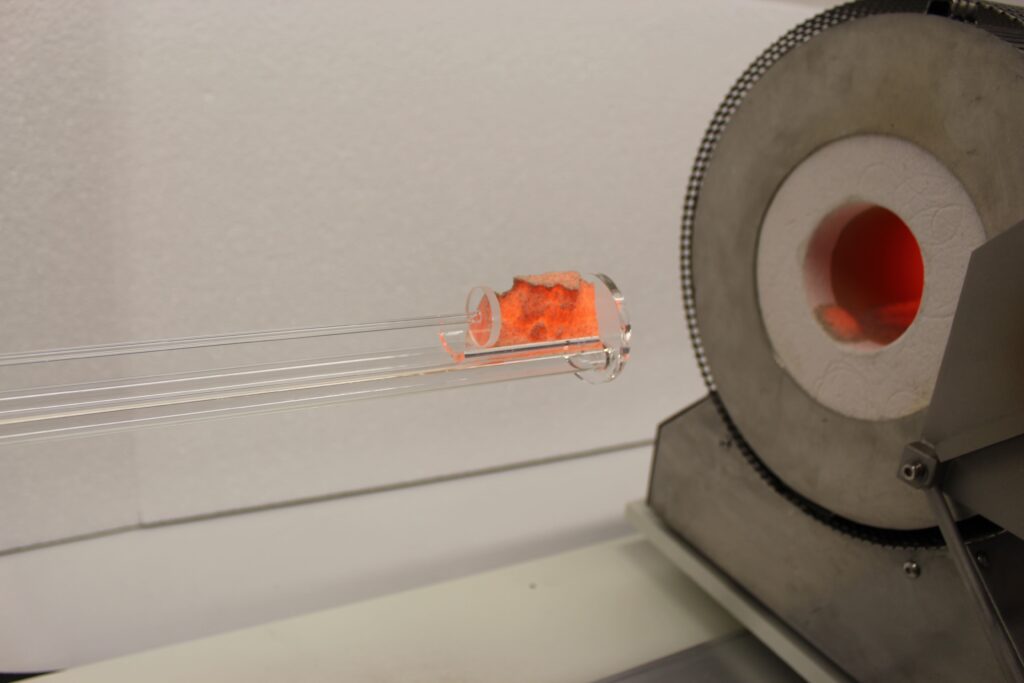
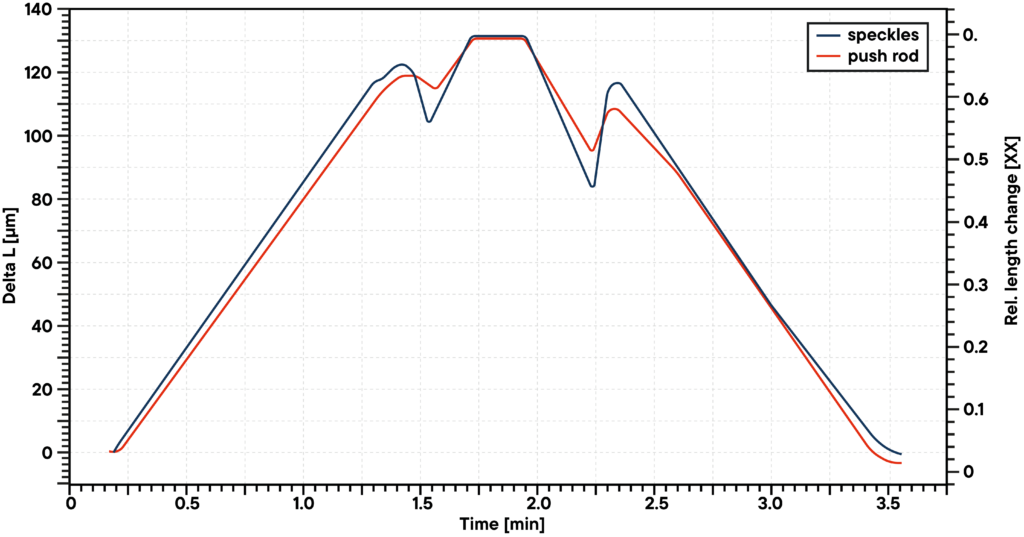
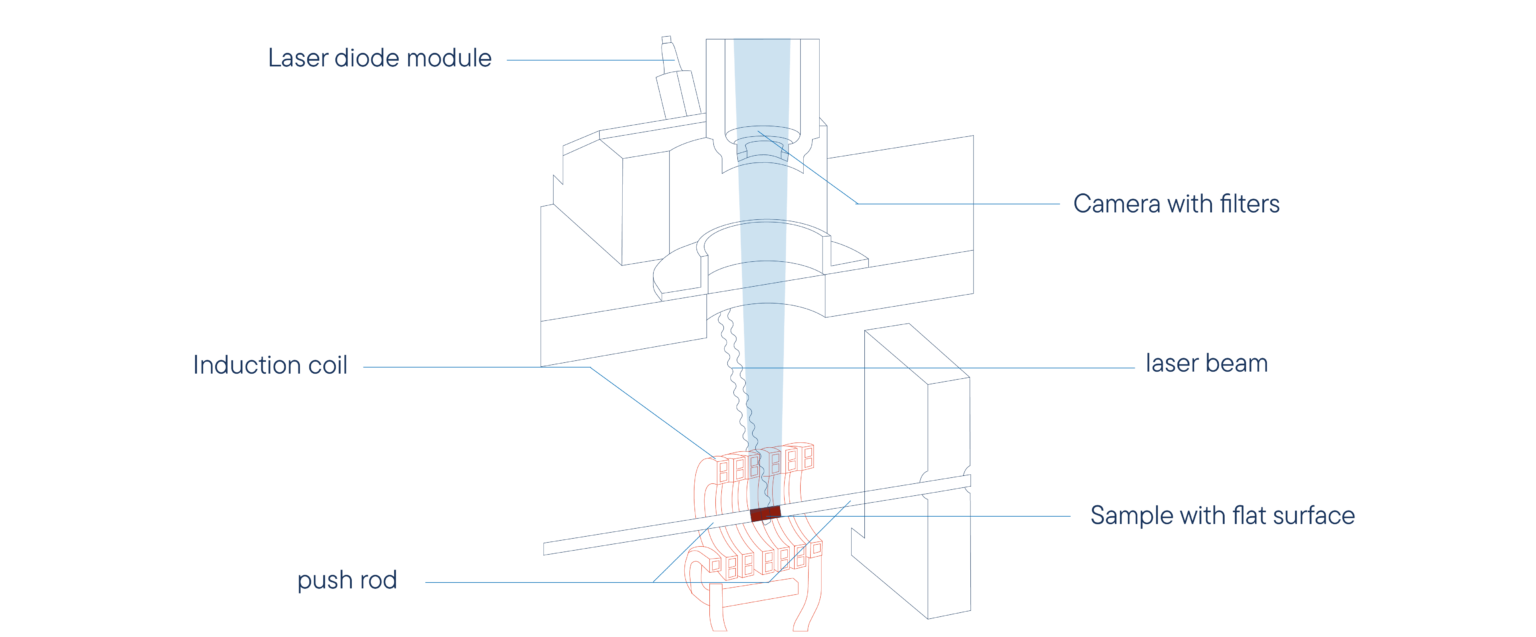
  • Optical Displacement Sensor / Optical Extensometer
  • Camera observes speckle patterns generated by
    laser
  • Camera images are evaluated after measurement
  • Size and position of areas are user definable
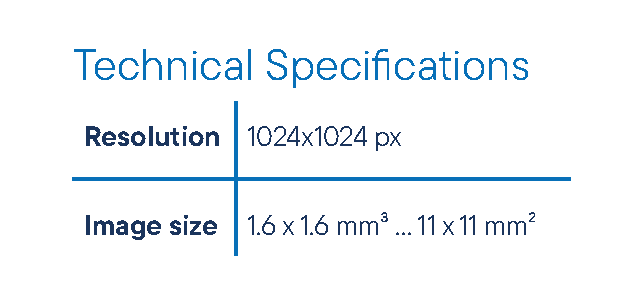
  • Up to 2 megapixel resolution
  • Determination of anisotropy
  • No markers required on sample
  • 2D dot matrix for selectable areas
  • Measure directly on the sample surface (no edge
    required)
  • 2-dimensional measurement possible
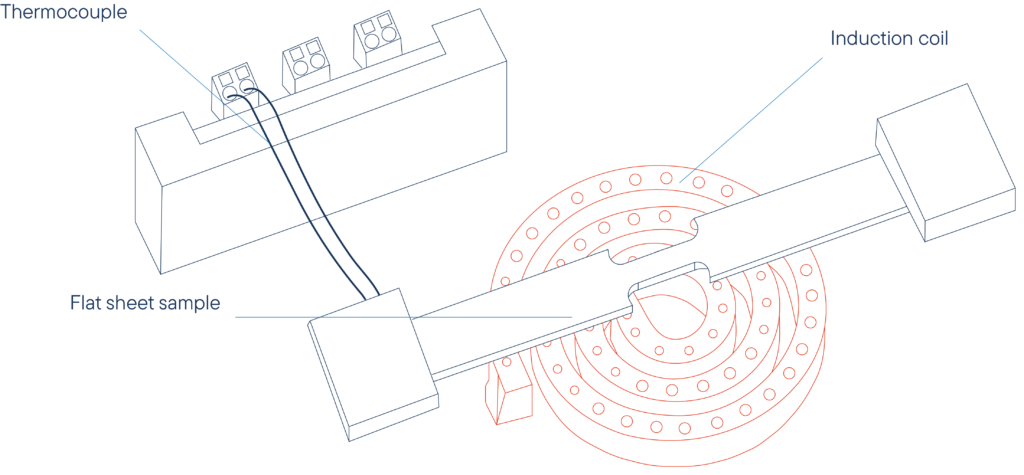
  • Small measurement area→ small temperature
    gradient
  • Length measurement very close to the thermocouple
    is possible
  • Relatively small gap in the coil required

Quenching mode design

Tensile mode design

Non-destructive laser ultrasonic NDT technology

Real-time insight into the grain growth

The laser ultrasonic (LUS) nondestructive testing (NDT) technique allows in-situ grain size analysis based on the evaluation of the frequency-dependent ultrasonic attenuation α(f), which is mainly caused by grain boundary
scattering due to the applied method. The frequency-dependent ultrasonic attenuation is modeled by the following power law:

The attenuation coefficient α(f) is composed of an absorption coefficient α, a scattering coefficient b, the frequency f and the exponent n, where the absorption coefficient describes the internal friction losses and the
scattering coefficient is the interesting grain size parameter (proportional to the mean grain size). The exponent n results from the ratio of the
acoustic wavelength to the mean grain size, where three types of scattering can be distinguished, Rayleigh (n=4), stochastic (n=2) and
geometric scattering [1]. The relationship between the scattering coefficient and the grain size of interest D is modeled as follows:

Comparison of the real-time laser ultrasonic grain size calculations (points) with the micrograph analysis of quenched samples (colored X markings) of plain carbon steel AISI 1045

The scattering coefficient b is the product of the material dependent parameter C and the relative change in mean grain size D-D0 (D0 – initial grain size). Calibration of the model using mean grain size values from micrographs at specific temperature conditions yields the parameter C [2].
Figure 2 shows an impressive comparison of these real-time LUS results (dots) with several time-consuming micrograph analyses (colored X markers).

Source:
[1] S. Sarkar, A. Moreau, M. Militzer, and W. J. Poole, “Evolution of austenite recrystallization and grain growth using laser ultrasonics,”
Metall. Mater. Trans. A Phys. Metall. Mater. Sci., vol. 39 A, no. 4, pp. 897–907, 2008, doi: 10.1007/s11661-007-9461-6.
[2] T. Garcin, J. H. Schmitt, and M. Militzer, “Insitu laser ultrasonic grain size measurement in superalloy INCONEL 718,” J. Alloys Compd., vol. 670, pp. 329–336, 2016, doi: 10.1016/j. jallcom.2016.01.222.

Laser ultrasonic measurements and data analysis using this attenuation model provide real-time (in-situ) insight into the grain growth of a material during thermal cycling. In-situ laser ultrasonic testing replaces time-consuming measurements and provides results in real time.

Real-time, in-situ measurement of:

  • Recrystallization
  • Grain growth
  • Grain size
  • Phase transitions
  • Elastic constants

Software

Making values visible and comparable

Our intuitive software interface ensures effortless operation, even for complex measurements. With its streamlined workflow, comprehensive data analysis tools, and real-time monitoring capabilities, the software empowers users to achieve reliable results with minimal training.

General Features

  • Program capable of text editing
  • Data security in case of power failure
  • Thermocouple break protection
  • Repetition measurements with minimum parameter
    input
  • Evaluation of ongoing measurement
  • Storage and export of evaluations
  • Export and import of data ASCII
  • Data export to MS Excel
  • Multi-methods analysis (DSC TG, TMA, DIL, etc.)
  • Zoom function
  • 1st and 2nd derivative
  • Free scaling

DIL Features

  • Display of relative/absolute shrinkage or expansion curves
  • Presentation and calculation of technical/ physical expansion coefficient
  • Semiautomatic evaluation functions
  • Special Software package for creation of CCT / CHT / TTT diagrams

Applications

Phase transformation of steel

For creating a CCT diagram, the sample is quenched at different
cooling rates. Depending on the cooling rate the sample may transform into different microstructures. The sample temperature and transformation start and end temperatures are transferred into the CCT
diagram.

Isothermal transformation

The graphic on the left side shows length and temperature of a sample for creating a TTT diagram. While sample temperature remains constant the sample transforms into a different microstructure.

Continuous Cooling Transformation Diagram (CCT)

The CCT phase diagram represents the phase transformation of a material when it is cooled at various controlled rates. CCT diagram allow the prediction of the final microstructure of the
measured steel. This crystalline structure determines the physical
properties of the material. The L78 Q and L78 Q/D is the ideal tool to observe small dimensional changes under extreme conditions of controlled cooling. With the intuitive Software it is easy to prepare CCT,
CHT and TTT diagrams from the test results.

Flow curve

The diagram shows the mechanical stress that is applied to
the sample while the sample is compressed at a constant displacement rate or at a constant true strain rate. The sample shown here was compressed at 5 mm/s at 100 °C.

Videos

Well informed

Downloads

Everything at a glance