Description
To the point
Mass spectrometry (MS) is an analytical technique to measure the mass of atoms or molecules. In case of thermal analysis, the samples are usually given as gaseous compounds, e.g. evaporated from a sample material which has been heated up. The resulting spectra are used to determine the elemental or isotopic signature of a sample, the masses of particles and of molecules, and to elucidate the chemical structures of molecules. Mass spectrometry works by ionizing chemical compounds to generate charged molecules or molecule fragments and measuring their mass-to-charge ratios by putting the charged molecules in a magnetic field (quadrupole) and monitor their interaction.
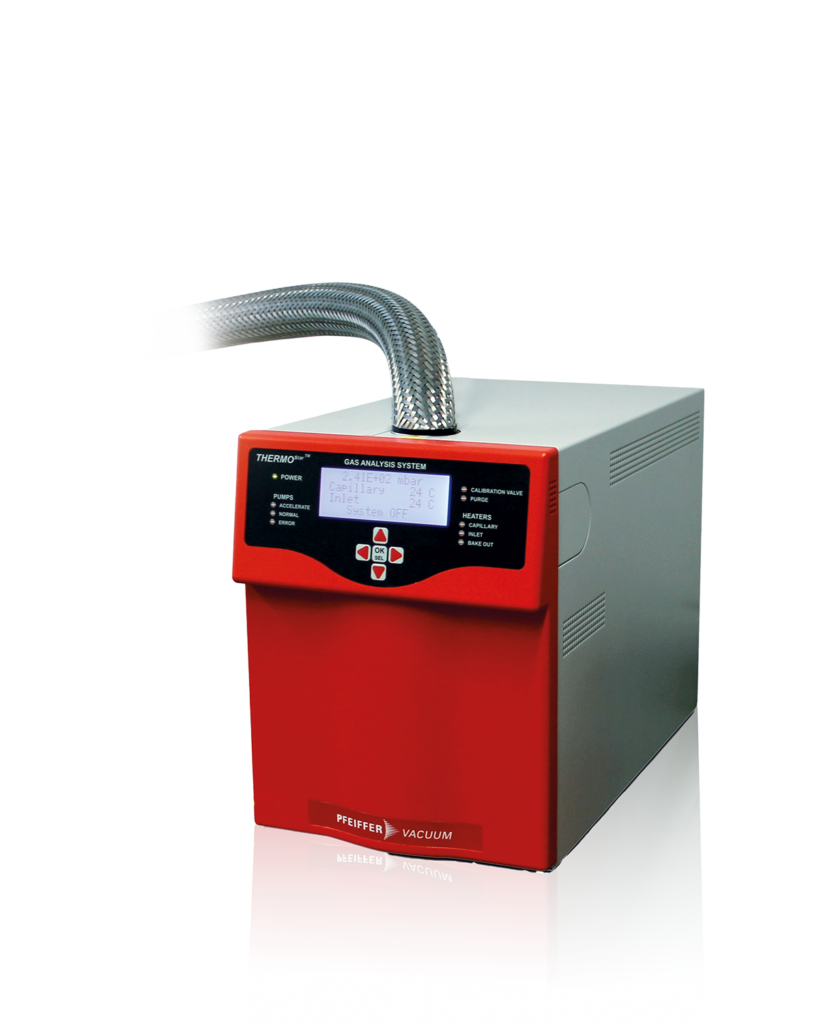
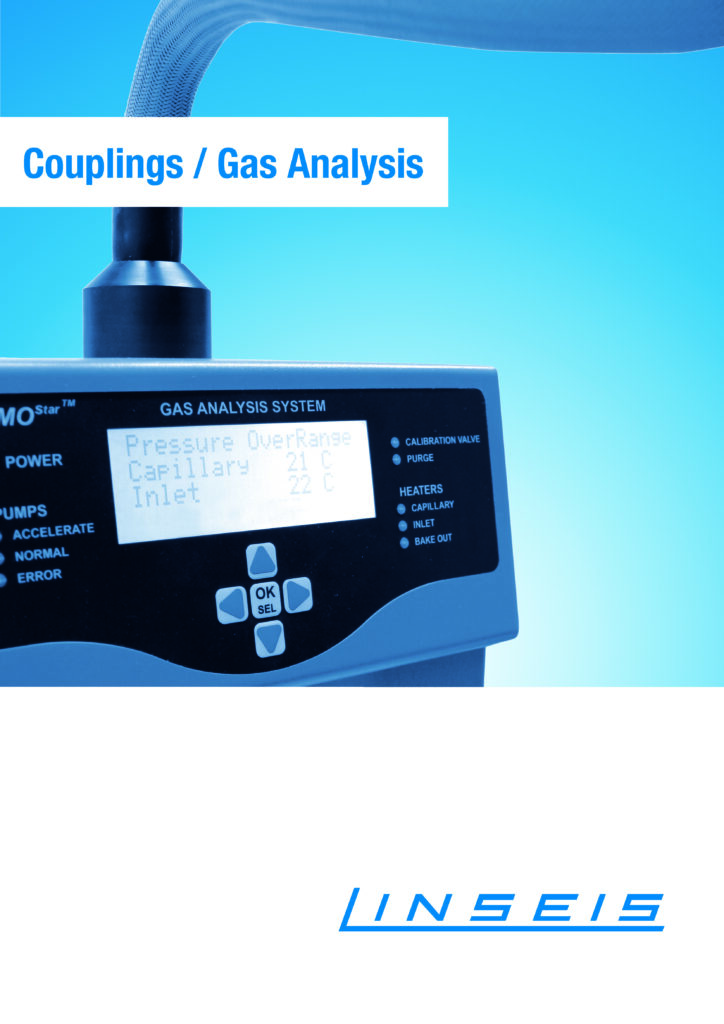
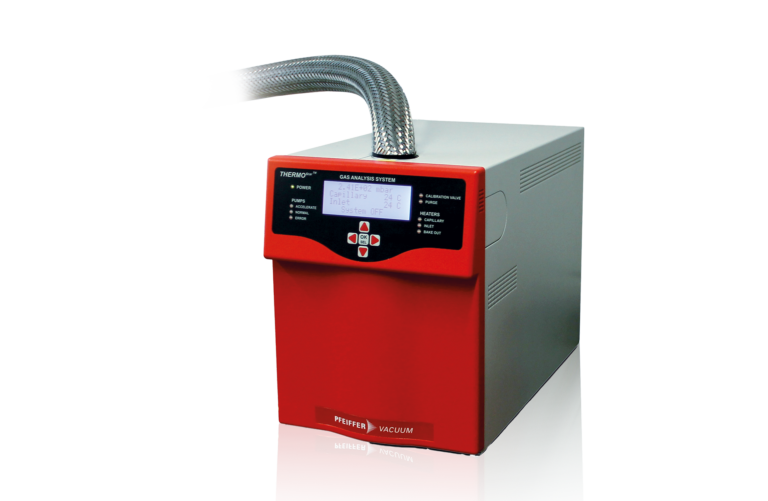
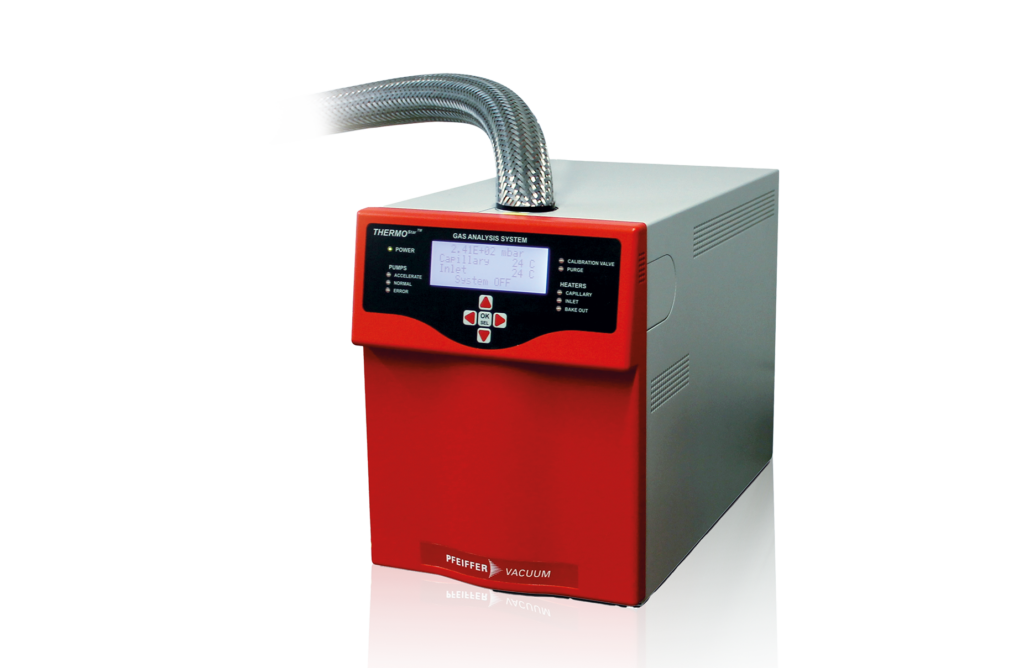
The QMS – quadrupole mass spectrometer coupling device is a state of the art mass spectrometer with a heated inlet system. The QMS is used for the analysis of volatile decompositions. All Linseis instruments provide an integrated software solution to allow simultaneous evaluation of thermal analysis and EGA-technique.
The coupling of the Linseis thermobalance with a mass spectrometer provides a very reliable EGA (emission gas analysis).
This can deliver very interesting information for material characterization in the development of new ceramics, pharmaceuticals or polymers and metals. Even investigations of the environmental compatibility of the outgassing products, e.g. in waste disposal/incineration or in car paint shops are possible.
Characteristics
- Top-shell research balance (various models); TG or STA (TG+DTA/DSC)
- High-resolution (0.1/0.5/1µg) simultaneous TG/DSC or TG/DTA
- High sample weights max. 25g
- Pfeiffer/MKS mass spectrometer (0 – 100 AMU, 0 – 200 AMU,
0 – 300 AMU) - Easily exchangable quartz capillaries
- Three separate heating zones: capillary/TG protection tube/adapter head of mass spectrometer
- Low purge gas flow rates possible
- Specially developed Al2O3 “sniffer nose” for extracting the outgassing
- Joint display of TG and MS signals
- Vacuum-tight system
- Specially developed sample chamber geometry
Unique Features
High detection sensitivity:
Heated capillary up to 300 °C.
Compatibility:
Easy coupling with thermobalances (TG),
simultaneous thermal analysis (STA)
and other thermoanalytical devices.
Flexible geometry for optimal fitting into available labspace.
Three separate heating zones:
Ensuring minimal dilution effects
and precise results.
Versatile applications:
High resolution online gas phase mass spectroscopy up to 300 AMU
Robust design:
Vacuum-tight system for
reliable and repeatable
measurements.
Questions? We're just a call away!
+1 (609) 223 2070
+49 (0) 9287/880 0
Our service is available Monday to
Thursday from 8-16 o’clock
and Friday from 8-12 o’clock.
We are here for you!
Specifications
Hard Facts
MODEL PFEIFFER THERMOSTAR | EGA - QMS (L40 EGA QMS/EGA COUPLING / GAS ANALYSIS) |
|---|---|
| Mass range: | 100/200/300 AMU |
| Detector: | Faraday and SEV (Channeltron) |
| Ion source: | Electron impact, energy 100 eV |
| Vacuum system: | Turbomolecular pump and diaphragm pump (oil-free vacuum) |
| Heating: | Adapter head, capillary and QMS |
| Coupling with: | DSC, TGA, STA via heatable adapter accessories |
Available accessories
Pulse-Analysis
The Pulse-Analysis injects an exactly predetermined amount of liquid or gas into the Thermobalance (TGA) or Simultaneous Thermal Analyzer (STA). This enhances the measurement possibilities significantly: the MS or FTIR can now be calibrated. Outgassings can be quantified precisely with this method.
MS-Sniffer
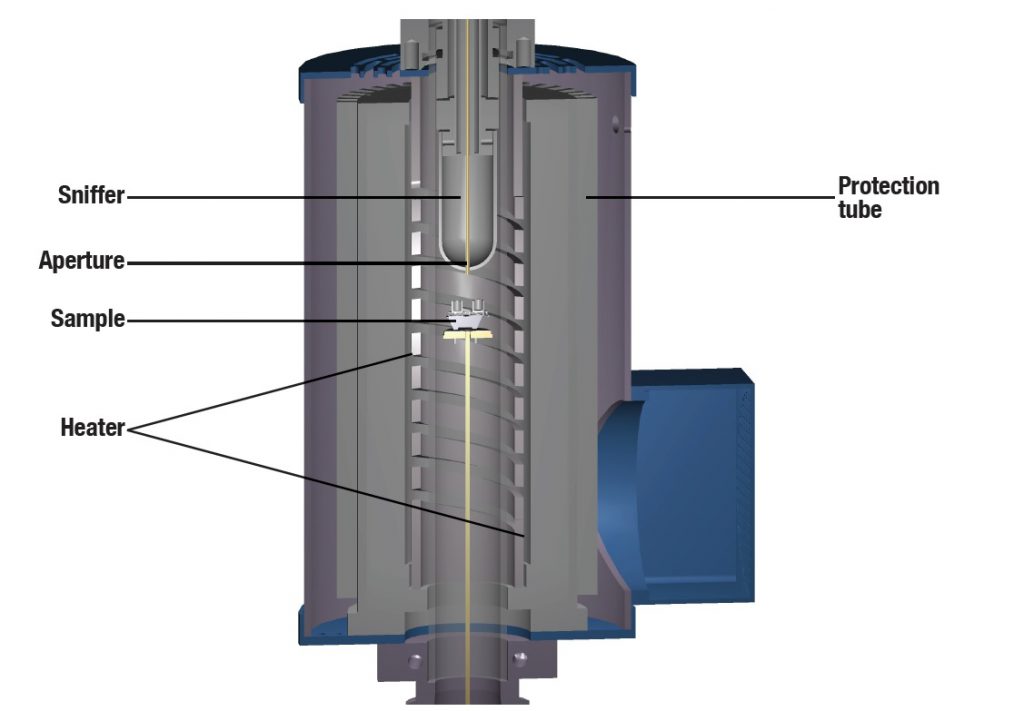
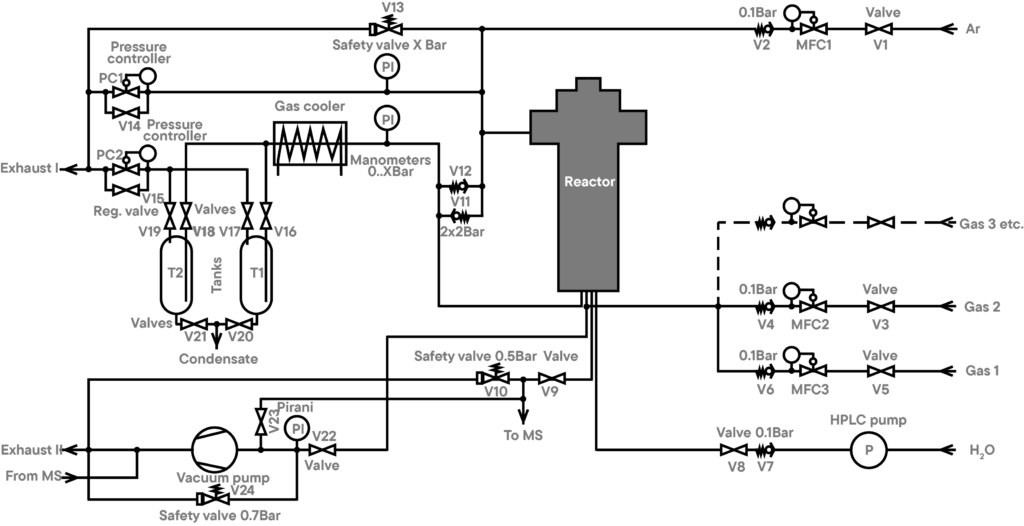
Due to the limitation of the input pressure of the MS, the sample gas must be taken after a pressure controller (at ambient pressure). So, only substances which can pass through the cold trap can be analyzed.
The outgassings of the samples are passed to the QMS-analyzer directly, using a very small aperture. This small aperture (or orifice) reduces the pressure inside the pressure vessel to the input pressure allowed for the QMS. Since this aperture is inside the hot zone of the furnace, condensation of the out gassings can’t take place. Since between the aperture and the ion-source of the QMS a vacuum of app. 1e-5 mbar exists, condensation there is also impossible.
The sniffer is placed directly above the sample. This is possible because of the the sniffer material, which can resist the temperatures in the hot furnace area.
Applications
Application example: Cement
The combination of thermal analysis with mass spectroscopy is a very powerful method to identify and quantify the components of the raw material and it is also a tool for the simulation of the manufacturing process of building materials. The components of cement raw material are: mixture of ceramic components (gypsum, calcium carbonate, etc.) and also organic components.
Analysis using STA and L40 EGA QMS
The picture shows the simultaneous thermogravimetry (TG, upper dark blue curve) combined with differential scanning calorimetry (DSC, upper red curve) and mass spectroscopy (MS). The mass spectrometry allows the identification of the evolved gases from the material. Mass spectrometry shows peaks from H2O at low temperatures most probably from gypsum. The DSC peaks and the signal from mass spectrometer between ~300°C – 400°C indicates the decomposition of organic components. The peak of CO2 at ~800°C indicates the decomposition of CaCO3. At ~1300°C CaSO4 decomposes (SO2 – Peak).


Application example: Decomposition of CaC2O4
The evolved gases from the decomposition of calcium oxalate have been fed into the mass spectrometer with a heated capillary. The ion currents for mass numbers 18 (water), 28 (carbon monoxide) and 44 (carbon dioxide) have been imported into the graph.
The red TG-curve shows three significant mass loss steps that also are visable at the blue DSC-curve as endothermic events. The first one at app. 150°C is the loss of crystalline water which can be seen by mass spec as a rise in intensity of the ion currrent 18 trace. The second effect at 450°C shows the loss of a CO-molecule that is monitored by the ion current trace 28. And finally the third step at roughly 750°C shows the loss of CO2, visable as peak on ion current 44.
Well informed
