

Table of Contents
Phases in material characterization
Materials can be categorized and described in different ways. This can be done, for example, based on their external appearance, certain physical parameters, or even more subjective impressions, such as smell or taste.
Density, Hardness, Heat Capacity, or Conductivity
To capture the chemical composition as precisely as possible, material properties that are clearly defined and measurable are usually described. Material constants such as density, hardness, heat capacity, or conductivity are often used for this purpose. These values are constant for most materials as long as the phase to which they refer is stable.
State of Matter
A phase is usually a homogeneous composition in the material. The term phase can refer to the state of matter (solid, liquid, or gaseous), but also to the crystal lattice structure within a certain zone in the solid or chemical modifications. It is important to note that a substance can exist in different phases at the same time.
Determining Phase Transitions
To know in which phase a material is currently in and thus when which parameters apply, it is particularly important to know and determine the phase transitions of a material. These usually occur when a certain temperature or energy level is reached or under the influence of pressure or chemical reactions.
What phase transitions are there?
Since there are different definitions of phases (state of matter, crystal structure, modification, etc.), there are also different phase transitions. In the simplest case, a phase transition describes the pure change of a state of matter, e.g., from solid to liquid.
Phase transitions are usually classified according to the so-called Ehrenfest classification by Paul Ehrenfest.
In this context, thermodynamic quantities such as volume, enthalpy, or entropy are usually considered as a function of temperature.
Phase transitions are then divided into so-called orders, where the nth order of the function of the considered quantity against temperature shows a discontinuity in the nth derivative. The function itself and the n-1th derivative are continuous. In practice, only phase transitions of the 1st and 2nd order are distinguished.
Examples of 1st order phase transitions are:
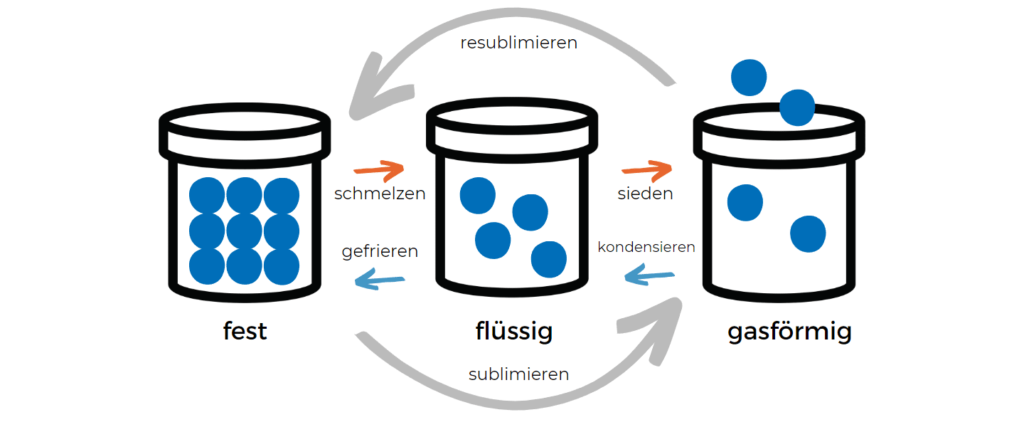
- Transformations between solid, liquid, and gaseous states of matter, in particular
- Melting (transition from solid to liquid)
- Evaporating (transition from liquid to gaseous)
- Sublimating (transition from solid to gaseous)
- Solidifying or freezing (transition from liquid to solid)
- Condensing (transition from gaseous to liquid)
- Resublimating (transition from gaseous to solid)
Examples of 2nd order phase transitions are:
- Change between ferro- and paramagnetic behavior at the critical or Curie temperature
- Change between different magnetic orders, e.g., from commensurate to incommensurate magnetic structure
- Change between ferro- and dielectric behavior
- Transition to superconductivity
Typically, in a 1st order phase transition, there is a jump in the order parameter (e.g., density, entropy, free enthalpy). In 2nd order phase transitions, on the other hand, the transition in the order parameter is continuous. Only in the second derivative is there a sudden change, e.g., in heat capacity.
How can I measure phase transitions?
Phase transitions are usually measured in thermal analysis using a Dynamic Differential Calorimeter DDK (English Differential Scanning Calorimeter – DSC).
If a substance shows a phase transition during measurement using DSC in the measured temperature range, for example, due to a change in the state of matter or the crystal structure, this can be well tracked using DSC. Most phase transitions are accompanied by energy absorption (endothermic) or release (exothermic), which can be detected as a change in heat flow.
The DSC measures these temperature changes through one or more thermocouples that are in contact with the sample holder, thus comparing the exact sample temperature with the ambient temperature and a reference sample. The exact heat flow of the sample at a given time can then be read from the difference between the reference and the sample. In the case of a difference in heat flow between the sample and the reference, the sign of the difference indicates whether an endothermic or exothermic process is taking place.
The position of the occurring effect when plotted against temperature also indicates very precisely when it occurs. The more precisely the exact sample temperature is measured, the better the resolution and sensitivity of the DSC.
For phase transitions, especially for second-order phase transitions, the heating rate is very crucial for how well the transition can be detected. If the heating rate is too slow, the effects are often hardly detectable, as the energy difference between the sample and the reference is compensated by the oven or heater. If heated too quickly, the effect becomes more visible but is also shifted to higher temperatures.


